How to understand that the processor is faulty
The surest sign of a component failure is the inability to start the operating system. As current continues to flow to the board, the coolers will rotate, you will hear characteristic signals from the mini-speaker, but you are guaranteed not to see the familiar OS window. The sound alert just indicates that the automatic performance test cannot be successfully completed.
In less serious situations, when the component we are considering is, in principle, still capable of working, but will soon fail, when you try to turn it on - or immediately after starting the OS - you will have the happiness of seeing countless blue screens. When you look at this next time, pay attention to the error code: it will show which part of the PC refuses to work normally.
Other signs, direct and indirect, of CPU problems include:
- Freezes that start at a certain time, sometimes pass safely, and sometimes end with crashes.
- Strong heating of the CPU, and at times - of the entire system unit. Typically, such overheating is accompanied by an emergency shutdown.
- Signs of charring on the CPU itself or adjacent surfaces.
- Errors during a processor error check that is automatically launched during startup.
In the latter case, you will certainly hear specific squeaks indicating a malfunction. For different BIOS, the sequence of sounds is different:
- For AMI - five short signals running continuously one after another.
- For AST - one signal of the same duration.
- For Phoenix - a sequence of four, then two, then again four monotonous sounds.
You will hear such notifications only as a last resort, when further correct operation of the equipment is clearly impossible. Therefore, it makes sense not to put off testing until the last minute, but to carry out a few simple manipulations now.
Stress test or how to check the temperature of the processor, hard drive, video card
To find out the temperature of the components, in the AIDA64 interface at the top you need to click on the icon in the form of a diagram - System Stability Test , as indicated in the picture.
In the new window, in the top chart by default, you will see the temperature of your processor and HDD/SSD in Celsius. The bottom chart shows the CPU load as a percentage.
To test the desired computer component, you need to check the box next to it. Tests are available for the processor, FPU, cache, RAM, hard drive and video card. Then click on the Start button at the very bottom.
In the first diagram, you can track the temperature rise of the specified components that contain sensors. Normal processor temperature is up to 75 degrees, tolerable up to 80, if more, then cleaning the CPU cooling system and replacing thermal elements (thermal paste, thermal pad) is required. The normal temperature for a hard drive is up to 45 °C.
Sometimes when the processor overheats, a red message may appear in the bottom diagram - “CPU throttling overheating detected”. This inscription indicates that the processor has started skipping clock cycles, thereby greatly reducing performance. This problem will disappear after the cooling problems are corrected.
If you decide to finish the stress test of the processor and other components, then click the Stop button, after which you can close the window.
Checking the CPU by installing it in another computer
Of course, checking the processor for functionality can be carried out in this way. This is quite difficult, but it allows us to clearly establish that the cause of the detected problems is not in the component we are considering - or, on the contrary, in it. If the transfer manipulations are carried out correctly, there is no threat to either the PC or the processor itself - however, you will have to face two unpleasant difficulties:
- The need to have another working computer with a similar configuration on hand. This does not always happen, and using equipment belonging to friends or colleagues for experiments is not entirely reasonable.
- Labor-intensive reinstallation. The internal components cannot be rearranged in five seconds. On both machines you will have to remove coolers and processors, swap them, and then, upon completion of the “research,” move them to their original positions.
Instead of this method, you can use simpler testing methods - for example, using the special applications listed below.
AIDA64 system stability test
The test is used to test and verify the functionality of all components. Under Tools , select System Stability Test . Now you need to get acquainted with all available stress tests.
- Stress CPU - regular stress testing of the central processor. In principle, it allows you to check the processor for serviceability and performance. In comparison, it uses simpler algorithms for loading it.
- Stress FPU - CPU testing using floating point calculations. Performing a wide range of mathematical operations on real numbers uses the full power of the processor.
- Stress cache - checks the health of the processor cache. Used to reduce the average access time to computer memory. If necessary, the processor checks whether a copy of the data is available in the cache.
- Stress system memory - stress test of RAM. Instantly loads all available memory to determine if there are problems, for example, with its compatibility (relevant for different sticks).
- Stress local disk - testing the installed hard drive. Loads by reading and writing data on the drive. Suitable only for classic local disks (on a connected hard drive).
- Stress GPU(s) - stress testing of one or more video cards. Instantly loads the graphics card, using it to the maximum. Allows you to check the performance of the video card on Windows 10.
Checking CPU in Windows Task Manager
But first of all, you should turn to the built-in tools of the operating system. In particular, to the universal utility “Task Manager” . It does not require installation or any configuration, is present in all OS releases - and allows you to check the processor quickly and with fairly accurate results.
To open the utility, use one of the options:
- Sequentially, without removing your fingers from the previous keys, press Ctrl , Alt and Delete , selecting the task manager.
- Or find the “Start” and right-click on it, select the desired one from the list of functions that appears.
When the built-in application window opens, switch to the “Processes” . In the second column from the left of the summary table, you will be able to see how busy the CPU is currently and which programs are accessing it the most. Don’t worry: a value close to zero does not indicate inoperability, but the absence of complex tasks being performed.
How to check processor performance
Unfortunately, the built-in OS tool does not allow for full diagnostics of components. You can get the most general information and find out if there is a need for further “research” - and then move on to the real check.
The main criterion showing that the latter is needed is a constantly continuing processor load at the level of 85–95%. It is almost impossible to work in this mode, and since unloading does not occur, it makes sense to think about replacing the component. It is very likely that it is working fine - it just no longer meets the growing demands of the system.
It’s another matter when the load remains at almost zero level, but the computer continues to freeze, showing virtually no signs of life. This behavior clearly indicates a malfunction - and the sooner you start diagnosing your PC, the better.
The answer to the question of how to check the load on the processor can be unequivocal: use applications that allow you to objectively assess the state of the machine. We can recommend several options:
- PC Wizard . An easy-to-use product that helps you easily analyze PC performance - both overall and individual components. Among other things, you will find here detailed characteristics of the processor, graphics adapter and other components.
- CrystalMark . A freely distributed product through which you can find out the main characteristics of the machine, as well as run quick tests that do not overload the system.
- PCMark . One of the most ideal options. The utility includes over 45 diagnostic modules. Based on the assessment results, the application gives your PC scores: the higher the score, the better.
In addition to the listed applications, there are many others, more or less similar to these. We talked about most of these programs that allow you to check the performance of your computer in the article at the link. Choose any option that seems suitable to you - and if you get a negative result, don’t be lazy to check the characteristics using another program.
CPU test program #1: AIDA64
As we noted above, the real state of the component can only be shown by the processor load. The test is carried out using appropriate products - and AIDA64 remains one of the best options to this day. The application includes a huge variety of options, allows you to perform comprehensive diagnostics, the results of which present the most objective information. Due to the well-thought-out, completely Russian interface, both specialists and inexperienced users will be able to work with it.
To run the first, most revealing test, use the following instructions:
- Open the main application window. Find the list of “Service” and select the sub-item GPGPU .
- If you want to check only the CPU, without using other available options, check the second checkbox from the top, called CPU , and then click Start .
- Wait a few minutes for the utility to complete its diagnostics. During this time, the processor will be subject to almost one hundred percent load; To make the application's task easier and eliminate the possibility of a crash, close all unnecessary programs and background processes. You will see the test results in a convenient summary table.
- You can save the results shown by the processor check utility as an image using the Save .
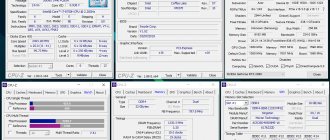
Let us draw your attention to one important detail. The application evaluates CPU performance in absolute rather than point values. Consequently, you will receive “bare” characteristics - in order to understand how good or bad they are, you will need to compare the data obtained with the indicators of other similar assemblies. If you are planning to upgrade in any case, you can focus on exemplary characteristics - for example, modern processors. The information obtained for a properly functioning processor is presented in the screenshot below.
As you can see, the first three lines are dedicated to the state of memory. Data processing speed is determined by repeatedly performing a write and read cycle. The higher it is, the more efficiently your machine operates. The same applies to the FLOPS : a greater number of operations performed in single and double check mode indicates the excellent condition of the computer. Since the calculations, despite their accuracy, are probabilistic in nature, we highly recommend conducting at least two diagnostic cycles.
Other tests in AIDA64
Previously, we looked at a general stress test for all main components; AIDA64 also has individual ones:
- Disk test
- Cache and memory test
- GPGPU test
To do this, click on the top “Service” tab and select the required test.
Disk test
By selecting the disk test, you will see a new window, at the bottom of which you can select the hard drive for further testing and the test method from the drop-down list. Once selected, click Start.
- Read Test Suite - reading a test suite
- Linear Read - linear reading
- Random Read - random reading
- Buffered Read - buffered reading
- Average Read Access - average read access
- Max Read Access – maximum reading access
Cache and memory test
Having selected the memory and cache test, you just need to click on the Start Benchmark button and wait for the end.
The test allows you to measure the speed in RAM and processor cache. Measurement takes place according to four criteria:
- Read - reading
- Write – record
- Copy - copying
- Latency - delay
RAM in the program is indicated as Memory, Level 1 Cache as L1 Cache, Level 2 Cache as L2 Cache, Level 3 Cache as L3 Cache - it is absent in AMD processors and is present in Intel.
GPGPU test (video cards)
The video card test process is similar to the previous one, after opening the window, click the Start Benchmark button and wait for completion.
I think there is no need to decipher anything here; in general, everything is clear. In the window you will see the speed of reading, writing, copying video memory. Since the integrated video card was tested, the video memory is used from RAM, hence the similarity of the numbers with the previous RAM test.
Monitor diagnostics
In AIDA64, in the “Service” tab, there is also a function for checking the integrity of the LCD screen; if there are dead pixels or colors are incorrectly transmitted, you can see them during the test. To run the diagnostics, press the Auto Run Selected Test or Run Selected Test button, but in the second mode you will have to scroll manually using the right/left/up/down arrows on the keyboard.
CPU stress test #3: OCCT
The third application, which we recommend using to obtain reliable information about the current state of the machine, is distributed completely free of charge. It will give you the ability to stress the CPU for testing, but be careful - testing the CPU with this program can be harmful to a faulty system. For example, the computer may freeze or shut down. After downloading and launching OCCT, you can choose in which mode the component will be loaded and which modules will be used for this.
During the “research” process, you will be able, as in previous cases, to observe the current parameters displayed in the form of a constantly updated graph. Diagnostics will help to identify not only the lag of your equipment compared to the reference one, but also specific errors that over time lead to complete failure.
During normal activities, such defects will not be visible - the application will clearly determine whether there is a potential or real danger. Everything is logical: if the state of the CPU has not yet reached critical, the load created under normal conditions does not reach the maximum and does not allow us to confidently judge the presence of problems. To avoid the possibility of a blue screen, check the instructions below from time to time.
According to the developer, no matter how weak your machine is, you won’t have to waste much time. We advise you to free up at least one hour for diagnostics in advance, but in most cases, especially if you prudently close unnecessary processes, the processor test program will take you no more than 35–45 minutes.