Program interface:
English
Platform:XP/7/Vista
Manufacturer:
Arthur Liberman
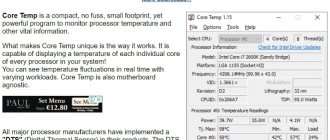
Core Temp
- a small, but very useful utility that allows you to monitor the temperature characteristics of the processor in real time. It’s no secret that under increased load, the processor temperature sometimes, to put it mildly, goes through the roof. And in order not to destroy the processor ahead of time, this utility was created. It seems that, first of all, it will be interesting and useful to all those who are involved in overlocking, that is, overclocking the processor.
Key features of Core Temp
I would like to immediately note that this program is absolutely free, both in terms of distribution and in terms of the terms and conditions of its use. Installation is not a problem, and the installation file itself is ridiculously small (only about 1.6 MB).
As for the operation of this utility, it has quite good functionality, which, first of all, is expressed not only in tracking changes in processor temperature, but also in the ability to view detailed characteristics of the processor itself. Moreover, regarding temperature specifically, the application is capable of providing such data for each processor installed in the system, as well as for each core included in a particular processor.
This can be very convenient even in cases when you doubt whether, for example, one of the kernels is working. As for the characteristics that can be found out about the processor using this program, it is worth noting the following: CPUID, APICID, processor type, clock speed, platform, VID, number of cores and their current temperature. As for the temperature characteristics, they will be very useful for overlockers, since overclocking the processor to clock frequencies higher than stated inevitably leads to an increase in temperature. In this case, it is necessary to strengthen the cooling system. Because, it’s no secret that at elevated temperatures without proper cooling, the processor simply cannot withstand the load, and you will have to buy a new one. But this is still an extra expense.
In principle, the temperature of the central processor (or processors, if there are several of them installed in the system) can also be found in the BIOS settings. However, it must be said that ordinary users are not inclined to enter such settings. Yes, they don’t need it, by and large. This application, as it turns out, is much more convenient to use. Moreover, you can always look at the characteristics of your processor, even those that are missing if you look at, say, the properties of “My Computer” or “Device Manager”.
In general, in the end, I must say that we have a fairly powerful utility that many users will enjoy. Plus, it does not contain absolutely any unnecessary functions, which would simply get users into the weeds if they delved into them. Well, what puts it in the category of accessible programs, of course, is its completely free distribution, stability and reliability of operation. Plus, the application supports the entire series of Intel Core and Core 2 processors, as well as all AMD processors in the AMD64 line.
Core Temp is a type of narrow-profile programs for Windows that determine the technical characteristics of a particular hardware component of a computer. The specificity of the program is the processor, the heart of the computer. Free, simple, with support for the Russian language, Core Temp not only provides information about the labeling and power parameters of the processor, but also allows you to monitor the temperature of each core and is equipped with a customizable overheating protection function. Below we will consider in detail the capabilities of the Core Temp program.
Installing Core Temp
The program is absolutely free and you can download the installer from its official website.
When the installer is downloaded, run it. At all steps of the wizard, just click the Next button. We will only be interested in this window:
If you want to enable support for remote temperature monitoring using a smartphone, you need to check the box next to Install Core Temp Remote Server plugin. Then click Next until the program is completely installed.
Processor Specifications
After installing and launching Core Temp, in the program window we will see individual technical characteristics of the processor, in particular, model, socket, voltage, frequency, current load percentage for each core. At the bottom of the window the temperature will be displayed - the maximum permissible and current indicators. Next to them we will see the minimum and maximum processor temperature indicators that the program recorded for a certain period of time.
The Core Temp window contains a link to update the processor driver. But this is not a link leading to a specific web page for downloading a driver from the manufacturer’s official website, as many programs offer to determine the hardware characteristics of a computer. The link in the Core Temp window leads to a web page for downloading the next program to install and update drivers automatically.
Program tools
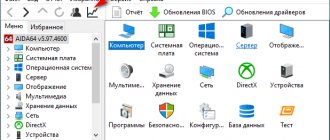
We will find more detailed information about the processor in the “Tools” menu by selecting “System Information”.
Among the software tools, it is also worth noting the “Screenshot” menu item, which allows you to quickly take a screenshot of the Core Temp window, for example, to transfer it to an experienced system engineer. Another notable option in the Tools menu is for resetting the minimum and maximum CPU temperature readings. This option is useful for monitoring the temperature at a new stage, for example, after eliminating the suspected causes of overheating.
How to use
Now, having finished with the theory, we can move on to practice and figure out how to download the Core Temp application for free and install it.
Download and Install
First, we must move to the very end of this page and download the archive with the program, with which we will monitor the processor temperature. After this we proceed as follows:
- We unpack the resulting archive, and then run the executable file. The installer of our program will launch. In the first step, we should simply move on to the next step.
- Now we accept the application license agreement. To do this, switch the checkbox to the position shown in the screenshot below with the number “1”, and then move on.
- If necessary, here you can change the directory in which the program will be installed. In this case, we will leave everything as it is and just move on to the next step.
Along with this look: All versions of Microsoft Visual C x32/64 Bit
- We are waiting for the Core Temp installation process to complete.
Now that we are done with the instructions for installing the program, we can briefly look at how to use it correctly.
Operating instructions
When the application is launched, we recommend that you immediately go to its settings. Moving from tab to tab, you configure the utility in the most convenient way for yourself.
In addition to displaying the temperature, which is shown in the main program window, we can use one of several additional tools:
- Checking for a BIOS update.
- Enable or disable journaling.
- Reset maximum and minimum values.
- Launch the plugin manager.
- Display additional information about the system.
- Applet G15.
- Register dump.
- Screenshot.
Please note that there is a hotkey for each function.
Configuring indicators in the system tray
After starting the program, temperature indicators for each processor core will be displayed in the Windows system tray. But these are the default settings; the data displayed by the program in the system tray can be customized. In the Core Temp window, click the “Options” menu and select “Settings”.
The “Advanced” tab suggests, in particular, changing the current temperature indicators of the processor cores to values that remain until the critical temperature is reached.
In the Notification Area tab, temperature indicators can be turned off by selecting the normal program icon to display in the system tray. The current temperature indicators of the processor cores can be replaced with the highest recorded temperature indicators - in fact, a more informative parameter for cases of unstable processor behavior. Temperature indicators in the system tray, if necessary, are supplemented with indicators of frequency, percentage of processor load, percentage of RAM usage.
The temperature unit changes from Celsius to Fahrenheit in the Display tab. Here you can also select the most convenient color for displaying high and critical processor temperatures.
In the “General” program tab, all organizational aspects are configured, in particular, the launch of the program along with Windows is activated.
CPU overheat protection
Overheating protection in Core Temp can hardly be called a “must-have” feature. Firstly, the best protection against overheating of any computer hardware component is an urgent visit to a service center if the problem is not solved by simply cleaning the system unit from dust. Secondly, modern AMD and Intel processors, as a rule, are equipped with this function at the BIOS level. These are the same cases when the computer turns off spontaneously immediately after booting or after several minutes of operation. The “native” protection is triggered. But in cases where the processor is not equipped with such “native” protection, you can resort to the overheating protection function offered by the Core Temp program. But even if the processor is equipped with overheating protection at the BIOS level, this same function as part of Core Temp will still benefit from the ability to more flexibly configure the computer’s behavior when a critical temperature is reached. At a minimum, setting your value to the latter, a couple of degrees below the limit.
To activate and configure the processor overheat protection function, in the Core Temp “Options” menu, click the “Overheat protection” item.
In the window that appears, activate the “Enable protection” option.
In the first block of settings, we can refuse the “Automatic” item, which provides a software alert when the set critical temperature is reached (its value is defined at the bottom of the main Core Temp window), and select another possible option – “Enable when the set temperature is reached.” This setting will allow you to set your own critical temperature value. What value should I set? The optimal processor temperature range is from 35 to 55°C. If the temperature has reached 65°C, you already need to take action to identify the cause of the problem. Therefore, instead of the critical temperature indicator of 90°C proposed by the program, you can set a value from 75 to 85°C. Perhaps this will save the processor from complete failure. In any case, if the processor temperature goes beyond the optimal limits, you can hardly count on full-fledged computer operation. The device will slow down.
The Core Temp program offers three types of reactions when fixing the critical processor temperature. The first reaction is notifications from the program itself in the form of pop-up tips and/or blinking Core Temp icon on the taskbar. Perhaps such a reaction from the program will be sufficient if the user is constantly at the computer.
The second reaction is to launch the designated program (executable file “.exe” or “.bat”). This could be, for example, a program or script that sends the desired message to the desired subscriber via Internet or mobile communications.
The third reaction is direct actions aimed at protecting the processor from overheating. When the specified critical temperature is reached, Core Temp will be able to turn off the computer or put it into sleep mode.
Have a great day!
The processor temperature is one of the most important parameters in the system. The processor temperature must strictly fluctuate within operating ranges for stable computer operation. This is especially important if you are overclocking the processor or working on a fairly powerful laptop.
There are many programs for monitoring the temperature on your computer’s processor; let’s look at the simplest and, at the same time, functional programs.
Is it possible to delete the Temp folder and what is it for?
Most likely, you will not be able to remove it, since it will contain programs that are currently functioning. But, let's first figure out why it is needed?
So, in the Windows system, all folders with files are divided according to certain parameters. They can be divided into system folders and user folders.
Folders and system files are those that are used only by the Windows OS itself for its normal functioning. When a person interferes with the operation of such files, for example, deletes them, this action can end disastrously for the overall operation of the computer. The computer will start to malfunction or stop starting altogether.
But, if a person uninstalls a user folder, this will in no way affect the system itself. The program whose folder you deleted will simply stop working for you. Or it will start to have errors and glitches. In this case, it is better to completely remove this program and install it again if you still have its distribution.
Regarding the Temp folder, I want to say that it belongs specifically to the system folder. Its name is an abbreviation of the word "temporary". It can be translated as “Temporary”, which, in essence, is what it is. It stores temporary information in itself.
What does temporary information mean? This has its own nuances. The first is based on the fact that when you install any software, the OS uses this folder to save intermediate information. In other words, it transfers elements of the installed software into it, which then begin to form special modules necessary for installing this program on a PC. Then, after you have completely installed the software, these modules are no longer needed, and the system leaves them in the Temp folder.
Why it turns out that Windows does not always delete these files automatically is a topic for another article. But, most importantly, the system junk remains in this folder. Then, over time, it becomes more and more. And, if you do not remove it at least once a month, this may end badly for the system.
Another nuance is based on the fact that even Windows, during its operation, constantly adds certain information to our folder. But the OS tries to deny access to these system files to users.
Core Temp program. Download Core Temp. How to use Core Temp.
Core Temp
– a convenient program for displaying the temperature of your processor in the tray, as well as detailed information in expanded form.
To find out the processor temperature, you need to:
1.
Download and install the
Core Temp
Important! On the third installation page, uncheck the extra boxes.
2.
Let's launch the program. The values in the form of numbers will appear in the tray. These are real-time temperature readings of your processor. If the processor has several cores, then the number of digits will equal the number of cores. Those. The temperature is measured on each processor core separately.
3.
In order to find out detailed information about the processor, you need to right-click on the program icon in the tray.
Of particular note is the parameter “TJ. Max"
- this is the maximum permissible temperature (Celsius). Temperatures approaching these values will indicate overheating. The recommended processor operating temperature should be 15-25 degrees below the “TJ” value. Max".
Go to the program menu item Options > Settings to customize the Core Temp program for yourself. Here are a few settings we recommend looking at:
— Genera l> Start Core Temp with Windows
: Enabling this mode will allow you to constantly monitor the temperature without having to think about starting it. But if you only need the app occasionally, you may want to leave it off.
— Display > Run Core Temp minimized
: activate this item if you want the program to start automatically from Windows.
- Notification area > Notification area icons. This setting is responsible for visually displaying Core Temp in the system tray. You can choose to display just the app icon or display your CPU temperature. I recommend selecting the option to show “highest temperature” rather than the temperature on each core. You can also customize the font and colors.
If you choose to show the temperature in the notification area, you may need to change the temperature polling interval in the General tab of the Core Temp settings. By default it's set to 1000 milliseconds, but you can move it higher if the flashing numbers annoy you. Just remember that the higher you set it, the longer it will take for Core Temp to notify you if your CPU is overheating.
Core Temp can notify you about the temperature status, to do this, go to the Options > Overheat Protection menu and play with the settings, everything is intuitive there.
Core Temp what is this program and is it needed?
Hello everyone. So today we will talk to you about such a program as Core Temp, I will tell you what it is and you will be able to understand whether you need this program or not. Core Temp is a program that shows the temperature of the processor, but does it conveniently, you can easily monitor not only the temperature of the processor, but also its frequency, memory usage.. The program has a Russian language, is free, and does not load the computer at all, so Guys, this program can easily be classified as useful
But why check the temperature at all? Well, I don’t even know how to answer that simply. What can we say here? The higher the temperature, the less comfortable the device is to operate. But this is my personal opinion, it’s just that many users say that, for example, a processor can safely operate at 60 degrees, and a video card at 70, well, that’s for example. Yes, I agree, you can work, but for how long? But here there is no definite answer, because high temperature cannot have a beneficial effect on the service life of the device. In general, my opinion is that the processor temperature should not be higher than 45 degrees, that is, you need to strive for this, and the temperature of the video device should not be higher than 60, and it is better to be within 50 degrees. Well that's my opinion
Well, let’s return to our program, which means you can download it from the official website, from this:
https://www.alcpu.com/CoreTemp/
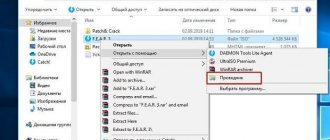
There you just click on the Download button and that’s it, download and install... Just be careful when installing, because if you don’t uncheck one box, then it seems that the game or its shortcut will still be installed, in short, I don’t know, but here’s the checkbox that is for this the game answers:
Honestly, it’s better to remove it, because it’s not clear what kind of kingdom you can build with Goodgame Empire.. By the way, at the bottom there is also a checkbox about creating a shortcut for adding to Core Temp, well, I don’t know what it is, but I checked it here I installed it just to check what it is. Alas, guys, but I couldn’t figure out what it was, even when I installed the program...
Anyway, guys, I launched the Core Temp program, this is what it looks like for me:
You see, such a small and simple program, but you will agree that it is still useful! Here you can see the processor model, socket, how many cores, how many threads, frequency, VID voltage, processor revision, technical process, thermal package (TPD), you see how much information Core Temp shows! And here it also hangs in the tray, in the tray from it there are two icons, each showing the temperature of a specific core:
I just have a Pentium G3220 processor, there are two cores, and there are two icons, but if you have four cores, then there will probably be four icons. So what else is there in the Core Temp program? Look, if you click on Tools at the top, the following menu will appear:
So what can be done here? You can check the update, you can even find out if there is a new version of the BIOS, there is also some kind of Plug-in Manager (I don’t know what it is), you can look at information about the system.. There is also something like the G15 Applet, but I’m not even close to what it is I can understand. But if you click on System Information in this menu, the following window will appear:
What can I say here, there is a lot of detailed information here, it may not be interesting to you, but the fact that this is a necessary thing is for sure. Because there really is a lot of information, you can find out everything about the process, and at the very bottom, well, if you scroll, it also shows the temperature of each core, well, look for yourself:
Guys, I clicked on Options at the top and this is the menu that appeared:
So, here we have the Settings item, I think it’s already clear what this item is, we’ll come back to it later. What is Temperature Shift? This is so that you can adjust the temperature. In short, what this means is this: if the program shows a temperature of 40 degrees, but in fact it is 30, then you can specify that the temperature in Core Temp should be shown 10 degrees less, well, so that it would be more correct, so to speak, you know? Then there is also something like Overheating Protection, these guys, you can configure the program so that it will do something if, for example, the temperature of the processor rises above 80 degrees. Well, what it will do, you can already configure it there, well, to do this, select the Overheating Protection item and then such a window will appear, here you can already configure it:
There is also a Compact mode item in the menu; if you select it, the Core Temp window will look like this:
And in principle, this look is also cool, it’s so compact and stylish, well, it seems to me
Okay, now let's go back to the Settings item, it is the very first one in the Options menu, so I selected it and the following window immediately appeared to me:
As you can see, the program itself is small, but it seems to have quite a few settings. This means that on the General tab you can change the temperature update interval, you can check the box here so that Core Temp starts with Windows. But you can uncheck the check for updates box, well, if you don’t want the program to get into the network. Then comes the Display tab, here it is:
Here you can check the box so that Core Temp starts minimized, you can check the box so that the program is minimized to tray when closed. You can also remove the icon from the taskbar, then the program will not be visible on the taskbar, but it can still be open. Then comes the Notification Area tab:
Well, here you can customize the icons, set some convenient font, adjust the colors, and here you can enable additional icons so that more information is shown in the tray. In general, you can experiment with the settings on this tab to make Core Temp more convenient, so to speak. Then there is the Windows Taskbar tab, here it is:
Here we are setting up some functions on the Windows 7 taskbar, but to be honest, I don’t really understand what functions we are talking about... In general, you need to play around with these settings to understand what they are for... Then there is another tab Logitech G1x/G5xx:
As I understand it, these are the settings of some Logitech device, but which one exactly is unclear, all that is clear is that this device has an LCD screen. Well, the last Advanced tab, here it is:
Here guys, there are some specific three ticks, the settings are so abstruse that even I don’t know what it is. If you know what it is, fumble around in these settings, then of course you can turn something on here, then decide for yourself, I personally don’t put any checkboxes here
Guys! I realized what these settings are on the Windows Taskbar tab! Do you know why I couldn’t figure out what it was? Because I had the Core Temp program button disabled on the taskbar! In short, on this Windows Taskbar tab you can configure what exactly will be displayed in terms of the indicator on the taskbar; this indicator is the program icon itself! In short, so that you understand everything, look, the Core Temp icon on the taskbar is turned on, and look, here is the icon itself:
Do you see that the icon is filled with a little green color, so to speak? Well, this is such an indicator! So I personally chose in the settings to make it green so that it would display how loaded the processor is and in the end everything works smoothly! So I loaded the processor to the maximum and the icon on the taskbar even turned red:
Damn guys, what a cool program this Core Temp is, I liked this trick with the icon. Cool program Core Temp, I personally like everything about it
Well, guys, in principle, you more or less understand what kind of Core Temp program this is and what it is needed for? I hope that’s clear. Now I’ll tell you one more piece of information, well, so to speak, it’s not very important, but I’ll write it anyway. In short, look, the Core Temp program runs under a process such as Core Temp.exe:
The program is installed and launched from this folder:
C:\Program Files\Core Temp
Well, this is how things are guys, as you can see, everything is fine with the Core Temp program, there are no jokes in it, a normal program without nonsense and without advertising. Now all that remains is to show how to remove it, but this is only in case you suddenly don’t like this program, because everything in life happens! So guys, before deleting the program, check that it is not running. Because I had it sitting in the tray, so I right-clicked on the Core Temp icon and there in the menu I selected Exit:
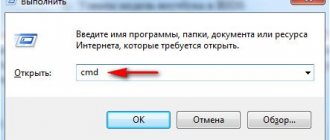
That's it, I left the program, now I can delete it. To delete, you need to hold down the Win + R buttons, then the Run window will appear, you write the following command there:
appwiz.cpl
Then clicked OK, after which the Programs and Features window will open, in the window there will be a list of all installed programs. Here you need to find the Core Temp program, here I have version 1.5.1, but you may of course have a different one, well, so, we found the program, right-clicked on it and select Delete:
Then you will see this message, you click Yes:
Then you will be asked if you need to save the current configuration? In short, does this mean saving the settings or not? If you install Core Temp on your computer again in the future, you can save the settings, but I personally will not install this program anymore, so I click No here:
Well, that's all guys, then the program will be deleted very quickly, in about a second, and you will see a message like this, where all you have to do is click OK:
Let's finish here, I wrote what kind of program Core Temp is and all that, I really hope that everything was clear to you, but if something is wrong, then you'll excuse me.
Good luck to you in life and may everything go well for you. Home! unknown programs 01/02/2017
HWMonitor program
HWMMonitor is a more functional program for monitoring not only the processor temperature, but also other important system elements.
HWMMonitor can be downloaded in two versions - as an .exe file and as a .zip file, the second option is a zipped version of the program that does not require installation. The first is the classic version in the form of an installation file.
1.
Download and install the HWMMonitor program.
2.
Open the program. The processor temperature can be found by scrolling the list below, in the CPU-mine item. Just like in the CoreTemp program, you will see the temperature on each of the cores of your processor.
Location of Temp directories
There are four Temp directories for storing cache entries that Windows uses most often;
- C:\Users\Username\AppData\Local\Temp;
- C:\Users\All Users\TEMP;
- C:\Users\Default\AppData\Local\Temp;
- C:\Windows\Temp.
Accordingly, where “user name” you need to insert the name of the user’s folder. The last line of the list (C:\Windows\Temp) is the location of the directory for storing the cache, but it relates to the system and therefore you shouldn’t go there unless absolutely necessary.
I’ll give a small example from my own experience when the system Temp folder can be cleared in Windows 10 and below. Once, one person approached me with a request to check the operating system for problems. He started having problems with the Internet, and the support service said that they had checked the Internet and everything was fine. In general, it turned out that his OS was simply completely clogged with various garbage and required a global cleaning of the system from all this rubbish. So, in that case, I cleared the system folder for temporary files.
For the convenience of people working with the OS at a professional level, that is, programmers, system administrators and the like, special variables were created, by typing which you can immediately find yourself in the Temp directory in Windows. The method will be described below, for now I’ll just say that this can be done using the “Run” system utility. The values themselves are as follows:
- %APPDATA% is equivalent to C:\Users\Username\AppData\Roaming.
- %TEMP% or %TMP% – will be equal to C:\Users\Username\AppData\Local\Temp.
- %SystemRoot%\Temp or simply TEMP or TMP - will go to the path C:\Windows\Temp.
- APPDATA – will open the following directory: C:\Users\Username\AppData.
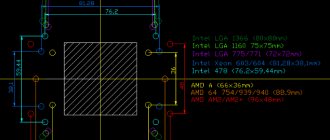
AMD CPU Temperature
Temperature monitoring for AMD processors is not much different from Intel processors. In the case of AMD processors, you will see two temperature options - “CPU Temperature” and “Core Temperature”.
"CPU temperature"
is a parameter that takes temperature readings from the physical temperature sensor inside the CPU.
"Core temperature"
- this parameter is not physical, but mathematical and is a derivative scale that simulates a core temperature sensor, because it is physically impossible to measure it.
Therefore, the displayed temperature in the BIOS may differ from the readings of programs such as Core Temp, etc., because in Core Temp we see exactly the “Core Temperature” parameter. Programs like HWMonitor show both of these parameters.
CPU temperatures are more accurate at low levels. Core temperatures are more accurate when your CPU is overheating.
We draw your attention to the Core Temperature feature. When your system is idle, the program will show fairly low temperatures, for example 15 degrees Celsius, but as soon as the load comes and the processor starts to heat up, the program will show a more accurate temperature and have more valuable information.
Monitoring your temperatures is a good thing and everyone should check it from time to time. But if your computer regularly overheats, there may be a deeper reason that needs to be addressed. Open Task Manager and see if there are any processes using your CPU and stop them (or figure out why they're out of control). Make sure you don't block any ventilation holes on your computer, especially if it's a laptop. Clean the vents with compressed air to make sure they are not filled with dust and dirt.
The older and dirtier the computer, the harder it is for the fans to work, and the harder they have to spin to reduce the temperature, which will still lead to overheating and very loud fans.
Summer! August! It's hot! Users have a much higher chance of frying the “heart” of their computer, so it is very important to monitor in real time how the processor temperature changes in order to prevent a problem called “overheating” in time.
Small and free program Core Temp
will display on the taskbar (in the notification area) the temperature of all processor cores, show how loaded it is and at what frequency it is running at a given time, and how much RAM is used.
I hope that the information listed above will make many users think about optimizing startup, pay attention to the number of programs running in the background (and in general to unnecessary unnecessary programs) ... in short - to reduce the load on the processor as much as possible and thereby get rid of “glitches” and slowdowns , speed up your computer.
If the “software” actions are not enough, then it’s time for you to climb into the system unit (or into the laptop case) and clean it of the dust that has accumulated there. By the way, have you recently changed the thermal paste under the cooling radiators? It tends to dry out over the years.
So, displaying the processor temperature and some other numbers in the notification area is not at all difficult - just run the Core Temp program.
Installing Core Temp
There is a small but nasty nuance in installing Core Temp, so don’t rush to click “Next” all the way...
Useful additional information on the website:
They offer to build some kind of kingdom - do you need it? Be sure to uncheck this box to avoid installing add-ons.
After successful installation, launch the program...
As you can see, there is a lot of information about our processor. Now all that remains is to customize the program for yourself...
Setting Core Temp
Click on “Settings” and turn on overheating protection - this function can save your computer from repair...
You can also look at “Settings” and...
More useful additional information on the website:
...install the Core Temp program into startup, simultaneously adjusting other parameters and values. For example, you can specify in what form to run the program or how to minimize it...
Here you can easily change the color of the numbers. If you changed the transparency of the taskbar or its color, the readings may merge and become unnoticeable.
The processor temperature is not the only value that can be displayed on the taskbar - check the boxes you need and get additional data displayed in real time.
For owners of Logitech mice of the G1x/G5xx series, the program provides a bonus...
To “Update Intel Drivers” there is a much better tool, which I have already described to you.
Now you will always have the processor temperature and other useful data before your eyes...
Sometimes when working with a PC, for one reason or another, you need to control the operation of the processor. The software discussed in this article exactly meets these needs. Core Temp allows you to see the current state of the processor. These include: load, temperature and component frequency. Thanks to this program, you can not only monitor the state of the processor, but also limit the actions of the PC when a critical temperature is reached.
When you start the program, processor information will be displayed. The model, platform and frequency of each core are displayed. The load on an individual core is determined as a percentage. The following is the general temperature. In addition to all this, in the main window you can see information about the socket, number of threads and component voltage.
Core Temp displays information about the temperature of an individual core in the system tray. This allows users to monitor processor data without going into the program interface.
Settings
By entering the settings section, you can fully customize the program. On the general settings tab, you can configure the temperature update interval, enable Core Temp autostart, and display the icon in the system tray and on the taskbar.
The notifications tab provides customizable settings regarding temperature alerts. Namely, it will be possible to choose which temperature data you want to display: the highest, core temperature, or the program icon itself.
Customizing the Windows taskbar makes it possible to customize the display of processor data. Here you can select an indicator: processor temperature, processor frequency, load, or select the option of switching all of the listed data in turn.
overheat protection
There is a built-in overheat protection function to monitor the processor temperature. With its help, a specific action is set when a certain temperature value is reached. By enabling it in the settings section of this function, you can use the recommended parameters or enter the desired data manually. On the tab, you can specify values manually, as well as select the final action when the temperature entered by the user is reached. This action could be turning off the PC or going into sleep mode.
Temperature offset
This function is used to adjust the temperature displayed by the system. It may be that the program outputs values that are 10 degrees larger. In this case, you can correct this data using the Temperature Offset
. The function will allow you to enter values both for an individual core and for all processor cores.
System information
The program provides a detailed summary of the computer system. You can find more CPU data here than in the main Core Temp window. It is possible to see information about the processor architecture, its ID, maximum frequency and voltage values, as well as the full model name.
Status indicator
For convenience, the developers have installed an indicator on the taskbar. When the temperature is acceptable, it is displayed in green.
If the values are critical, namely over 80 degrees, then the indicator lights up red, filling the entire icon on the panel with it.
Repacks from elchupacabra
Core Temp (Repack & Portable)
- a small program for monitoring processor temperature.
Shows the temperature of each core and each processor in the system separately. You can watch in real time how the processor temperature fluctuates as you load it. The program does not depend on the motherboard. Features of Core Temp:
• Core Temp is extremely easy to use and also allows users to make various modifications and extensions on a wide scale. • Core Temp offers a platform for plugins (additional software modules), which in turn allows developers to add new features and expand the functionality of the operating system they are using.
Supported processors:
• AMD: All FX series, All APU series, All Phenom / Phenom II series, All Athlon II series, All Turion II series, All Athlon64 series, All Athlon64 X2 series, All Athlon64 FX series, All Turion64 series, All Turion64 X2 series , All Sempron series (K8 and K10.5 based), Single Core Opterons starting with SH-C0 revision and up (K8 based), All Dual Core Opteron series (K8 based), All Quad Core Opteron series (K10 based), All Hexa Core Opteron series (K10.5 based), All 12 Core Opteron series (K10.5 based). • Intel: All Core i3, i5, i7 series, Atom, All Core Solo series, All Core Duo series, All Core 2 Duo series, All Core 2 Quad series, All Core 2 Extreme series, All Celeron-M 400 and 500 series , All Celeron E1000 and E3000 series, All Pentium E2000, E2100, E2200, E5000, E6000 and E7000 series, All Dual Core Low Voltage Xeons series (Yonah based. Untested), All Xeon 3000, 3200, 3300, 5100, 5300, 5400 , 5500, 5600, 6500, 7400, 7500 series. • VIA: All Nano series, C7 series and derivatives.
Features of the Core Temp repack:
1. Installation of the program or unpacking of the portable (from the developer) version combined in one distribution 2. Optional installation of the Core Temp Remote Server (remote monitoring) and Core Temp Grapher (load and temperature graph) plugins 3. Multilingual interface (including Russian) 4. Possibility pickup and autocopy of the user program settings file CoreTemp.ini
System requirements: Windows XP/Vista/7/8/8.1/10
File size: 2.3Mb
Visit: OFFICIAL SITE
Download Core Temp 1.16 (Repack & Portable): from Turbobit
Download Core Temp 1.16 (Repack & Portable): from Katfile
Download Core Temp 1.16 (Repack & Portable): with Up-load
Download Core Temp 1.16 (Repack & Portable): from Uploadrar
Direct download links (upload.ee / Yandex Disk) are available only for the “Patron” group (What is Premium?).