No user is immune from data loss from a computer or external storage device. This can happen in the event of a disk failure, a virus attack, a sudden power cut, or mistaken deletion of important data bypassing the trash can or from the trash bin. It’s not so bad if entertainment information is deleted, but if there was valuable data on the media? There are special utilities to recover lost information. One of the best ones is called R-Studio. Let's talk in more detail about how to use R-Studio.
Recovering data from a hard drive
The main function of the program is to recover lost data.
To find a deleted file, you can first view the contents of the disk partition where it was previously located. To do this, click on the name of the disk partition, and click on the button in the top panel “Show disk contents”.
The processing of information from the disk by the R-Studio program begins.
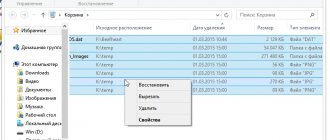
After the processing process has occurred, we can observe the files and folders located in this disk partition, including deleted ones. Deleted folders and files are marked with a red cross.
In order to restore the desired folder or file, mark it with a checkmark and click the button on the “Restore marked” toolbar.
After this, a window opens in which we must specify the recovery parameters. The most important thing is to indicate the directory where the folder or file will be restored. After we have selected the save directory and, if desired, made other settings, click on the “Yes” button.
After this, the file is restored to the directory that we specified earlier.
It should be noted that in the demo version of the program you can restore only one file at a time, and then no more than 256 KB in size. If the user has purchased a license, then group recovery of files and folders of unlimited size becomes available to him.
How to use R-Studio
Now let's move closer to working with the utility, consider its first launch of the interface and file recovery.
Launching R-Studio
When you first launch the program, it will ask for a license. I don’t need to tell you where to look for free licenses, or you can click the Demo button. It's fine for recovering small files. The maximum file size for recovery is 256 kb.
If the program window is completely empty, then you need to run it through the terminal using the following command:
QT_X11_NO_MITSHM=1 rstudio
Everything should now work.
2. R-Studio interface
The program interface is quite typical for this kind of utility. It can be divided into the following parts:
- Main menu - contains all available actions and functions;
- Toolbar - the main functions of the program are located here;
- Tabs - switch between different areas;
- Work area - divided into two parts, on the left side there is a list of disks or folders, and on the right side there is detailed information about them;
- Status bar - at the very bottom of the window there is a status bar, where messages about the operation of the program are displayed.
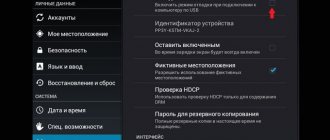
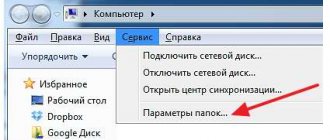
In the work area of the main window you will see a list of all disks and partitions. By default the program is in English, but you can choose Russian. To do this, open the menu “Help” -> “Language” and select “Russian” :
Easy recovery
As a reminder, regardless of the file system, files are not physically removed from the disk during deletion. But you can lose them forever if the file system overwrites them with something. If you accidentally deleted some data, it is better to immediately disconnect this hard drive from the computer and restore it by connecting it as an external drive to another device. We can scan the entire partition and identify all the file systems that still exist on it, but there is an easier way. You can only work with this file system. To do this, simply select the desired section and click on the toolbar “Show section contents” :
All deleted files will be marked with a red cross. To restore them, just click the “Restore” on the toolbar:
Next, you only need to select the folder where the files will be restored. Under no circumstances restore everything to the same partition; this may erase what could still be saved.
Scan partition
If you want to recover all the data, you need to scan the desired partition to detect all the file systems that were there and with which the utility can work. To do this, select the desired section and click the “Scan” . This process may take a long time, progress will be displayed on the right side of the work area:
Once the scan is complete, you will see all available file systems. Select one of them and click "Show disk contents" . By the way, the same option is available from the context menu:
Now, as in the previous case, you can see all available files and those that can be recovered are marked with a red cross. In addition, you can tick the required files on the right side and restore them as a group:
If it is a media or text file, then you can open it directly in the program, without performing rstudio data recovery.
Search files
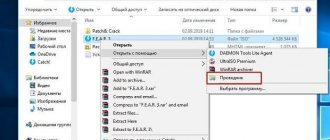
Very often, previous file systems have a very confusing directory structure and you don’t always remember what was where. But the program has built-in search capabilities. To configure the search, click “Find/Cancel” :
In the window that opens, you can choose where to search, what files to search, what format, you need or search for directories, and so on. In the drop-down list at the very top of the window, you need to select the parameter by which we will search, for example, extension, file name or regular expression.
After completing the settings, click "Ok". All found files will be displayed on the right side of the workspace and you can restore them.
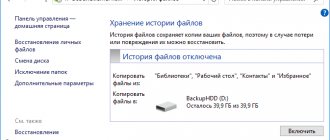
Creating images
When you work with a disk that has important deleted files, there is always a risk of damaging something. Therefore, you can create an image and work with it. “Create image” item on the toolbar :
The image creation process can take quite a long time. Then you can select “Open image” and continue working with the resulting image as with a regular hard drive.
Recovery by signatures
If, while viewing the disk, you do not find the folder or file you need, this means that their structure has already been damaged due to new files being written over the deleted elements, or an emergency violation of the structure of the disk itself has occurred. In this case, simply viewing the contents of the disk will not help, and you need to conduct a full scan using signatures. To do this, select the disk partition we need and click on the “Scan” button.
After this, a window opens in which you can set scanning settings. Advanced users can make changes to them, but if you are not very knowledgeable about such things, then it is better not to touch anything here, since the developers have set the default optimal settings for most cases. Just click on the “Scan” button.
The scanning process starts. It takes a relatively long time, so you will have to wait.
After scanning is completed, go to the “Found by signatures” section.
Then, click on the inscription in the right window of the R-Studio program.
After a short processing of the data, a list of found files opens. They are grouped into separate folders by content type (archives, multimedia, graphics, etc.).
In files found by signatures, the structure of their location on the hard drive is not preserved, as was the case in the previous recovery method; names and timestamps are also lost. Therefore, to find the element we need, we will have to look through the contents of all files of the same extension until we find the required one. To do this, simply right-click on the file, as in a regular file manager. After this, the viewer for this file type, installed on the system by default, will open.
We restore data as before: mark the desired file or folder with a checkmark, and click on the “Restore marked” button in the toolbar.
The R language to help the habra statistician
The following topic prompted me to write this article: In search of the ideal post, or the riddle of the hub. The fact is that after becoming familiar with the R language, I look extremely askance at any attempts to calculate something in Excel. But I must admit that I only became acquainted with R a week ago. Goal: To collect data from your favorite HabraHabr using the R language and carry out, in fact, what the R language was created for, namely: statistical analysis.
So, after reading this topic you will learn:
- How you can use R to extract data from Web resources
- How to transform data for later analysis
- What resources are highly recommended reading for anyone who wants to get to know R better?
The reader is expected to be independent enough to familiarize himself with the basic constructions of the language. The links at the end of the article are best suited for this.
Preparation
We will need the following resources:
- R language interpreter
- RStudio is a very convenient IDE for working with R
After installation you should see something like this:
In the lower right pane, on the Packages tab, you can find a list of installed packages. We will need to additionally install the following:
- Rcurl - for working with the network. Anyone who has worked with CURL will immediately understand all the opportunities that open up.
- XML is a package for working with the DOM tree of an XML document. We need functionality for finding elements by xpath
Click “Install Packages”, select the ones you need, and then select them with a checkmark so that they are loaded into the current environment.
Getting data
To get the DOM object of a document received from the Internet, just follow these lines: url<-“https://habrahabr.ru/feed/posts/habred/page10/” cookie<-“My top-secret cookies” html<-getURL(url, cookie =cookie) doc<-htmlParse(html) Pay attention to the cookies being passed. If you want to repeat the experiment, you will need to substitute your cookies, which your browser receives after logging in to the site. Next, we need to obtain the data we are interested in, namely:
- When the post was published
- How many views were there?
- How many people have added this entry to their favorites?
- How many clicks on +1 and -1 were there (total)
- How many +1 clicks were there?
- How much -1
- Current rating
- Number of comments
Without going into too much detail, I’ll just give you the code: published<-xpathSApply(doc, “//div[@class='published']”, xmlValue) pageviews<-xpathSApply(doc, “//div[@class='pageviews ']", xmlValue) favs<-xpathSApply(doc, "//div[@class='favs_count']", xmlValue) scoredetailes<-xpathSApply(doc, "//span[@class='score']", xmlGetAttr, "title") scores<-xpathSApply(doc, "//span[@class='score']", xmlValue) comments<-xpathSApply(doc, "//span[@class='all']", xmlValue) hrefs<-xpathSApply(doc, "//a[@class='post_title']", xmlGetAttr, "href") Here we used searching for elements and attributes using xpath.
Next, it is highly recommended to create a data.frame from the received data - this is an analogue of database tables. It will be possible to make requests of different levels of complexity. Sometimes you are amazed at how elegantly you can do this or that thing in R. posts<-data.frame(hrefs, published, scoredetailes, scores, pageviews, favs, comments) After generating the data.frame, you will need to correct the received data: convert the lines into numbers, get the real date in a normal format, etc. We do it this way: posts$comments<-as.numeric(as.character(posts$comments)) posts$scores<-as.numeric(as.character(posts$scores)) posts$favs<-as.numeric( as.character(posts$favs)) posts$pageviews<-as.numeric(as.character(posts$pageviews)) posts$published<-sub(" December in ","/12/2012 ",as.character( posts$published)) posts$published<-sub(" November in ","/11/2012 ",posts$published) posts$published<-sub(" October in ","/10/2012 ",posts$published ) posts$published<-sub(" September in ","/09/2012 ",posts$published) posts$published<-sub("^ ","",posts$published) posts$publishedDate<-as.Date (posts$published, format=”%d/%m/%Y %H:%M”) It is also useful to add additional fields that are calculated from those already received:
scoressplitted<-sapply(strsplit(as.character(posts$scoredetailes), "\\D+", perl=TRUE),unlist) if(class(scoressplitted)=="matrix" && dim(scoressplitted)[1]== 4) { scoressplitted<-t(scoressplitted[2:4,]) posts$actions<-as.numeric(as.character(scoressplitted[,1])) posts$plusactions<-as.numeric(as.character(scoressplitted [,2])) posts$minusactions<-as.numeric(as.character(scoressplitted[,3])) } posts$weekDay<-format(posts$publishedDate, “%A”) Here we have well-known messages like “ A total of 35: ↑29 and ↓6” were converted into an array of data on how many actions were performed, how many pros there were and how many cons there were.
At this point, we can say that all data has been received and converted to a format ready for analysis. I formatted the code above as a ready-to-use function. At the end of the article you can find a link to the source.
But the attentive reader has already noticed that in this way we received data for only one page in order to obtain it for a whole series. To get data for a whole list of pages, the following function was written:
getPostsForPages<-function(pages, cookie, sleep=0) { urls<-paste("https://habrahabr.ru/feed/posts/habred/page", pages, "/", sep="") ret< -data.frame() for(url in urls) { ret<-rbind(ret, getPosts(url, cookie)) Sys.sleep(sleep) } return(ret) } Here we use the system function Sys.sleep so as not to accidentally create a habra effect for the habr itself :) This function is proposed to be used as follows: posts<-getPostsForPages(10:100, cookie,5) Thus, we download all pages from 10 to 100 with a pause of 5 seconds. We are not interested in pages up to 10, since the ratings are not visible there yet. After a few minutes of waiting, all our data is in the posts variable. I recommend saving them right away so as not to disturb the hub every time! This is done this way: write.csv(posts, file="posts.csv") And read as follows: posts<-read.csv("posts.csv")
Hooray! We learned how to receive statistical data from Habr and save it locally for the next analysis!
Data analysis
I will leave this section unsaid. I invite the reader to play with the data himself and get his own long-lasting conclusions. For example, try to analyze the dependence of the mood of plus and minus people depending on the day of the week. I will give only 2 interesting conclusions that I made.
Habr users are much more willing to upvote than downvote.
This can be seen from the following graph. Notice how much more uniform and wider the “cloud” of minuses is than the spread of pluses. The correlation between pros and the number of views is much stronger than for cons. In other words: we add without thinking, but we minus for action! (I apologize for the inscriptions on the graphs: I have not yet figured out how to display them correctly in Russian)
There are indeed several classes of posts
This statement was used as a given in the mentioned post, but I wanted to make sure of it in reality. To do this, it is enough to calculate the average share of pluses to the total number of actions, the same for minuses, and divide the second by the first. If everything were homogeneous, then we should not observe many local peaks in the histogram, but they are there.
As you can see, there are pronounced peaks around 0.1, 0.2 and 0.25. I invite the reader to find and “name” these classes himself. I would like to note that R is rich in algorithms for data clustering, approximation, hypothesis testing, etc.
Useful resources
If you really want to dive into the world of R, I recommend the following links. Please share your interesting blogs and sites on the topic of R in the comments. Is there anyone who writes about R in Russian?
- Free online courses on CodeSchool in R
- Data Analytics Courses on Coursera
- Quick R
- R-bloggers
- is.R()
I believe that languages such as R, Haskell, lisp, javascript, python should be known by every self-respecting programmer: if not for work, then at least to broaden their horizons!
PS Promised source
Editing disk data
The fact that the R-Studio program is not just an application for data recovery, but a multifunctional processor for working with disks, is evidenced by the fact that it has a tool for editing disk information, which is a hexadecimal editor. With it you can edit the properties of NTFS files.
To do this, left-click on the file you want to edit and select “Viewer-Editor” in the context menu. Or, you can simply type the key combination Ctrl+E.
After this, the editor opens. But, it should be noted that only professionals and very well-trained users can work in it. An ordinary user can cause serious damage to a file by using this tool inappropriately.
Creating a disk image
In addition, the R-Studio program allows you to create images of the entire physical disk, its partitions and individual directories. This procedure can be used both as a backup and for subsequent manipulations with disk content, without the risk of losing information.
To initiate this process, left-click on the object we need (physical disk, disk partition or folder), and in the context menu that appears, go to the “Create image” item.
After this, a window opens where the user can configure the image creation settings for himself, in particular, specify the directory for placing the created image. It is best if it is removable media. You can also leave the default values. To directly start the image creation process, click on the “Yes” button.
After this, the image creation procedure begins.
As you can see, R-Studio is not just an ordinary file recovery application. Its functionality has many other features. We focused on a detailed algorithm for performing some of the actions available in the program in this review. These instructions for working in R-Studio will undoubtedly be useful for both absolute beginners and users with some experience.
We are glad that we were able to help you solve the problem. Add the Lumpics.ru website to your bookmarks and we will be useful to you. Thank the author and share the article on social networks.
Describe what didn't work for you. Our specialists will try to answer as quickly as possible.
R-Studio 8.14.179623 NE with embedded activation key
It is generally accepted that all the data on hard drives is the most expensive thing in a personal computer.
It’s hard to argue with this, because many people store very important information on their computer, for example, some data from work, or photos that have been accumulated for more than one year. In general terms, all this can be lost in one moment. Let's say the system picks up a virus that destroys all data, or you accidentally format the disk, in general, anything can happen. If you find yourself in this or a similar situation, you need the R-Studio program. Its developers claim that it provides an almost 100% guarantee of information recovery. True, there is one condition, the main thing is that the data is not erased using specialized software, otherwise it is simply impossible to restore it, especially if low-level formatting is performed. The program can return data from almost any media, it doesn’t matter whether it’s a flash drive or a local drive on a personal computer. You can return information after a virus attack, system failure, or simple deletion. Moreover, it can be returned even when disk partitions have been deleted or moved. R-Studio allows you to create a so-called “image” of a disk, which can be used in the future to completely restore information. The interesting thing is that the program can even work with encrypted files.
Currently supported file systems are: HFS/HFS+, Little and Big Endian variants of UFS1/UFS2 and Ext2FS/Ext3FS, FAT12, FAT16, FAT32, NTFS, NTFS5.
The entire contents of the disk can be edited in a hexadecimal editor. Each file found for recovery can be saved to any location on the computer, or on a network drive, if there is one. To start the process, just start the scanning process, after which you can see the list of available files to return. The action itself will proceed quite quickly, but in general everything depends on the amount of information, the less there is, the faster everything will end, and the more there is, the slower.
There is no need to activate the R-Studio 8 program, the registration key is built into the installation process, in other words, immediately after installation, the application is registered, you can work with it without any restrictions. By the way, the archive also has a portable version that does not require installation; it is also activated.
Screenshots:
Medicine: built-in serial number Size: 32 Mb Language: Russian
Download: R-Studio 8.14.179623