How to find out CPU load in Windows 7?
Hello everyone, I would like to tell you how to find out what the processor load is at the moment. I will show this using Windows 7 as an example, but in other versions of Windows everything is approximately the same. The processor is perhaps the most important device in a computer and indeed in other similar equipment, well, I mean PDAs, tablets and even smartphones.
Windows 7 allows you to see how much the processor is loaded at a given time and by which program. You know, some users buy a powerful processor, which is cool, of course, but they buy it so that nothing freezes on the computer. And I understand this too. But the funny thing is that with such a processor nothing really slows down, and all because a modern top-level processor is so powerful that the computer will work quickly even if there is a lot of garbage on it. This is all to say that in fact, a computer can quickly work even on a processor that was ten years old. It's all about optimization, which today simply means making sure there are no unnecessary programs on your computer that you don't need.. And that's all..
Well, of course, I don’t mean some kind of Pentium on socket 478, there will most likely be slowdowns. But for example, Windows 10 can easily run on the same Pentium D (775 socket) and at the same time it’s even fast
So, let's move on to our topic. To find out how busy the processor is, you first need to launch the task manager. To do this, right-click on the panel and select this item:
The dispatcher will open, there we immediately go to the Performance tab:
Do you see any graphs there? Well, there is a CPU Load graph, and it shows the CPU load as a percentage. Opposite this column you may notice a graph or graphs above which it says CPU Load History. These graphics, that's how many there are, that's how many cores your processor has. But there is another problem that Windows takes threads for cores. To find out how many threads and how many cores, I advise you to use the free CPU-Z utility.
On these graphs, Load and History, you can see how much the processor is loaded in real time. In general, I hope you understand. Now how can you find out which program is loading the processor? For example, I will launch WinRAR and enable the performance test there:
That is, I specially created a processor load and now see how to find out who exactly is loading the processor. In the manager, go to the Processes tab and there click on the CPU column and carefully look at who has the most percentage:
Well, as you can see, it’s easy to understand that the WinRAR.exe process is loading the percent! If you don’t know what kind of program it is, you can look in the Description column, the name of the program is usually indicated there. But it may be that it is empty. Then right-click on the process and select open storage location, the folder where the process started will open. Look carefully at the folder name, it may tell you what kind of program it is. Well, here’s an example, here’s the folder where the WinRAR.exe process started:
At the top you can see the name of the open folder, in this case this name is the same as the name of the program. Well, I think that everything has already become clear to you.
In Windows 10, it’s a little easier to see who is loading the percent, there you just need to go to the Processes tab in the manager, click on the CPU column on the left in the Name column, you will see what kind of program it is, in general, everything is almost the same, only it’s more convenient somehow everything is done:
Well, as a bonus, I’ll show you how to find out how many processor threads you have and how many cores you have. As I already wrote, if the processor supports Hyper-threading technology, then Windows itself will show threads as kernels in the manager. However, there is a way to see how many threads there are, it’s just a little tedious. You need to create any file with the nfo extension and open it, there will be a message saying something like it cannot be opened, and then after clicking OK a window will appear. There will be a line where the processor model and how many cores and also how many logical processors will be indicated. These are the flows!
Regarding threads, in Windows 10 there is already a division, well, that is, it indicates how many cores and how many threads, look where the threads are indicated (and the cores are higher):
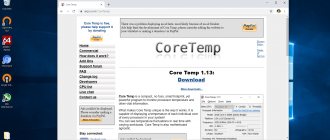
But advanced users still use the CPU-Z utility
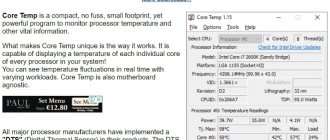
CPU-Z is easy to download on the Internet, it’s available almost everywhere, it’s a free and small utility, it’s easy to install, or even not necessary at all if the version is portable. Just downloaded and launched, for example, I have a Pentium G3220 processor and this is what the utility showed, there is enough information:
Now you see below there are Cores and Threads, well, these are cores and threads! That's how simple it is, CPU-Z is really a very useful utility
There is also the AIDA64 utility, it shows very detailed information about the hardware, but I don’t know why it doesn’t show how many threads there are? There is a lot of information, but it’s strange how many threads it doesn’t report. Well, maybe I didn’t find it.. but it seems like I dug everything up...
Well guys, I think I wrote everything, I hope everything was clear to you. I wish you good luck in life and less problems with your computer
To home! Windows 7 processor 07/29/2016
virtmachine.ru
How to find out what is loading the processor
After turning on the computer, its processor is constantly performing some tasks. If there are too many of these tasks or they are very heavy, the computer may begin to slow down. Both the user and the computer’s operating system, as well as installed programs, including malicious ones, can start the processor to execute tasks. How to find out how heavily the processor is loaded, what exactly it is doing at the moment, and also how to stop it from running certain processes will be discussed in the article. It should be taken into account that the “braking” of the processor can be caused not only by a high degree of workload, but also by simple overheating. What the processor temperature should be and how to check it, read here. It is convenient to monitor the degree of processor load in real time using the Windows Task Manager. To do this, you need to launch the task manager (read how to do this here) and in its window go to the “Performance” tab. Information about workload is displayed there as a percentage, as well as in the form of a chart. If tabs are not displayed in the task manager on your computer, you need to switch it to standard mode. You can find out more about this here. To get a list of tasks that the processor is busy with, you need to go to the “Processes” tab in the task manager. A list of currently active processes will open. Opposite each of them, in the “CPU” column, the percentage of central processor resources spent on its execution will be displayed. In addition, the “Description” column will contain information about the program responsible for launching the process, and the “User” column will contain the name of the user on whose behalf it was launched. To stop a process and free up the resources it occupied, you need to right-click on it and select “End Process” in the context menu that appears. Then confirm your intentions in the dialog box that opens. However, if some “heavy” process is running automatically all the time, constantly ending it “manually” is not the best way to solve the problem. It is necessary to find the cause of this disgrace and eliminate it. Most often, unreasonable load on the processor is created by:
Viruses
Viruses can “masquerade” as other programs installed on the computer. If you find in the Windows Task Manager that some process is constantly heavily loading the processor, first check your computer for viruses.
Startup programs
Many programs that a user installs on a computer are added to Windows startup and start with the computer in the background. The user may not even suspect that they are constantly working. They can update themselves, show different messages and advertisements, and perform other actions, consuming network traffic and computer resources. You can find out how to view the Windows startup list and remove unnecessary programs from it here.
The process svchost.exe
Very often, the svchost.exe process creates a large load on the processor.
It is used by many Windows system services, but viruses can also “disguise” as it. At the same time, it is typical for viruses to launch this process on behalf of the computer user. If you find such a case in your device manager, then your computer is 100% infected, since the “real” svchost.exe runs only on behalf of the system and some of its services. Another sign that svchost.exe is being used by a malicious program is that it launches through Windows startup. He can also get there only under the influence of viruses. Be sure to check your computer's startup list for entries with svchost.exe (see how to do this in the previous paragraph). But high svchost.exe activity is not always caused by malware. Windows Update, for example, also uses this process and can create a large load. To check this, you need to right-click on the svchost.exe process in the Windows task manager, which loads the processor the most, and select “Go to services” in the context menu that appears. A list of services will open, highlighting those that are involved in starting this process. If the Windows Update service is among them, then it is most likely the cause of the problem. You can solve it in several ways: 1. Wait without doing anything. When the download and installation of Windows updates is completed, the problem will disappear by itself. This is the most preferable way out of the situation. But if your computer slows down a lot and you can’t do without it at the moment, you can try other options. 2. Allow the svchost.exe process to use only part of the processor cores. This is done like this: • right-click on the “heavy” process svchost.exe in the Windows task manager; • in the context menu that appears, select the “Set correspondence” item; • in the window that opens, leave a checkmark next to only one or two processor cores (depending on how many of them the processor has in general) and click the “OK” button. 3. Completely refuse to download and install Windows updates. It is not recommended to do this, but if you are not very concerned about the security of your computer, then it is possible. For this purpose, it is enough to disable the Windows update system service, proceeding as follows: • press the Win+R key combination on the keyboard, type the command services.msc in the window that appears, and then press the Enter key; • in the list of system services that opens, find the service called “Windows Update” (see towards the end of the list) and double-click on it with the left mouse button; • a window will open in which, in the “Startup type” drop-down list, select the “Disabled” option, then click the “Apply” button; • close all open windows and restart the computer. www.chaynikam.info
How to view CPU and memory usage in Windows 7
How to view CPU and memory usage in Windows 7
The load on the processor and memory in Windows 7 can be found in various ways. In this article we will look at two ways to determine processor and RAM load:
- Using a gadget;
- Using the task manager.
CPU and RAM loading gadget
Step 1. Right-click on an empty space on the desktop and select Gadgets from the context menu.
Select the Gadgets item
Step 2. Double-click on the CPU Indicator icon (CPU is the central processing unit).
Double-click the “CPU indicator” icon
Done, the gadget is now displayed on the desktop.
CPU load and RAM usage gadget
Determining CPU load using Task Manager
You can determine the CPU load and the amount of RAM used using the task manager.
Step 1. Press the keyboard shortcut Ctrl + Alt + Delete and click the Launch Task Manager button.
Launching Task Manager
Step 2: Go to the Performance tab.
CPU usage and memory usage in Task Manager
The screenshot shows that more than 6.5 GB of RAM was used out of the 8 GB available. Such a large amount of memory is used due to the fact that several “heavy” applications are running simultaneously:
- Adobe Photoshop;
- Adobe Primere;
- Adobe After Effects.
To prevent the computer from slowing down when working with such programs, it is advisable to use a high-power computer.
Evgeny Mukhutdinov
www.pcbee.ru
How to evaluate test results
Directly from the temperature graph you can assess the condition of the video card cooling system. Understand how well it copes with its task under maximum load. Now let's look and analyze the FurMark testing results.
- Maximum operating temperature. First of all, the user should monitor the temperature during the entire test. Especially if you are testing a video card for the first time. For new graphics cards, it is better to use several programs to view the temperature. If the operating temperature is approaching critical, it’s worth thinking about.
- Fan rotation speed. It's simple. It’s good if the cooling system copes with the temperature even under critical loads and not at maximum speed. This means that there is still a small supply. For example, in GTX 780 max. the rotation speed is 69%, and already in the RX580 it shows 100%. But in the second case, this is no longer true...
- Memory operating frequencies. The load on the video card may cause the base clock frequency to differ from that stated by the manufacturer. Especially when operating at maximum temperatures. As with the CPU, automatic underclocking is possible. So, the video card is trying to restore normal temperature.
To avoid any questions about why the video card does not work after testing, monitor the temperature. Any approach to the maximum temperature should already alert the user. If the maximum temperature in the stress test is 80-90°C, this is already very unpleasant. Perhaps servicing the video card can slightly correct the problem.
STRESS TEST OF ZOTAC GEFORCE GTX 780 VIDEO CARD
Using the example of a 12-minute test, you can see an almost ideal temperature graph. The cooling system easily copes with its task. The maximum temperature stopped at 73-74°C. At the same time, the fan speed is only at the level of 69% (there is still a good margin).
STRESS TEST OF ASUS ROG STRIX RX580 VIDEO CARD
My new graphics card also shows some pretty interesting results in testing mode. The maximum temperature in the closed case, which is very important, remained at 74°C (opening the side cover immediately removes 2°C). The fan speed is displayed at 100%, which is very strange.
Firstly, a sharp increase in temperature on the graph indicates the use of passive cooling in a light load. Secondly, Radeon and GPU-Z Settings shows the fan speed at 65%. It is worth noting that the modified version of FurMark ASUS ROG Edition displays all values normally.
How to find out what is loading the Windows 7 processor?
Hello everyone, you are probably familiar with this when the processor loads something, but what it is remains a mystery. And at the same time, it’s simply terrible what’s going on on the computer, well, in the sense that nothing is happening - just brakes, glitches, freezes! What to do in this case? Well, some users prefer to immediately reboot, while pressing a button on the system unit...
But such a reboot, firstly, will not solve the problem, and secondly, it can harm the computer, or more precisely, the hard drive. If you do such a reboot often, bad blocks may form on the disk, and Windows may simply fly away. Why? The answer is simple: the fact is that while you press the button, Windows could copy something, write something, interrupting this process leads to errors on the disk...
The first thing you need to understand is who exactly is loading the processor this way, what kind of stupid process is doing it. So, here is a strategy, a plan, so to speak, to identify the culprit of the load. First, I solved the situation when something loads the processor, for this I used the WinRAR archiver. This archiver has a performance test, so I ran it:
After this, the test started and that is, the load began! And now look at how to determine who is loading the processor, let’s imagine that there is no type of test from WinRAR... Open the task manager and there click on the Processes tab, then click on the CPU column:
The process that has the most importance here is the one that loads the processor! As you already understand, my process is WinRAR.exe, but what should I do next? You can terminate it, just select it and click the End process button:
Well, then just confirm the action:
Well, what's simple? I think it's simple! But it can be difficult. What I mean is that sometimes before completing the process, it’s worth figuring out who he is, where he came from... That is, first it’s better to find out what kind of program it is, you can do it this way. Right-click on the loading process and select open storage location there:
This way you will find out where exactly the process is starting from, but the most important thing is that you will be able to see the process folder, which means the program folder.
Here's the folder I opened:
After the folder has opened, the loading process can already be completed so that it does not strain the computer!
It is already easier to understand what kind of program it is, because if you look at the place where the folder path is indicated, then it tells us which folder you are in. Usually the folder name is the same as the program. This is how you can find out the name of the program that is using the processor:
Now you know what this program is. In principle, you can remove it, but only if you are sure that you don’t need it! If you don’t delete it, there will be problems, I’m just warning you...
To uninstall, click Start, select Control Panel there:
And then find the Programs and Features icon:
In the window where there will be a list of all installed software, right-click on what you want to remove and select this item from the menu:
In my case it's WinRAR, but that's just an example! Then just follow the instructions, there will probably be a message there, like, are you sure you want to delete it and all that. But I’ll say right away that you can, of course, delete it, but again, only if you are sure of it!
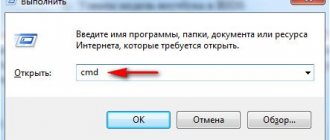
When you know what program is loading the computer, it’s easier to solve the problem. But it happens that this harmful program itself starts along with the computer! If you recognize her name, you can try disabling her autorun. Press Win + R, write the msconfig command there and click OK:
A window will open, in it we go to the Startup tab and see if there is anything in the list that belongs to the program and if there is, uncheck the boxes. This is the tab:
Just in case, if you have some strange CPU loading, I advise you to check your computer with some utilities, these are: AdwCleaner and HitmanPro. They are looking for ad viruses, this is something that ordinary antiviruses do not find, keep this in mind! Well, just in case, here is the Dr.Web CureIt! utility, it is the best for finding simple but more dangerous viruses such as Trojans, worms and other things!
Well guys, I hope now you can independently understand who is loading the percentage. I hope the information was useful
Good luck to you
To home! processor 07/28/2016
virtmachine.ru
Check video card online
In fact, it will not be possible to test a video card for stress resistance online. What plays a role here is not so much the stability of the connection as the limitations of how applications from the browser work with computer components. But you can find out whether this or that toy is suitable for your video card.
To do this, go to the official NVidia website and click on the “Find out if your computer is ready for new games” tab. All details about the video adapter will be displayed.
For a more in-depth check, it is best to use the above programs.
How to find out CPU load?
When a program starts, it begins to use a certain resource of the central processor for its work. The more programs running simultaneously, the higher the processor load. If you notice that your computer is running slower, then you need to look at what percentage of the processor is loaded. It is possible that there is some program running in the background that is using a lot of its resources.
Instructions
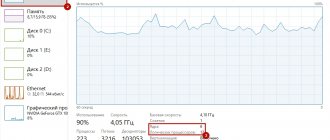
The easiest way to find out what percentage of the processor is loaded is this. Press the keyboard shortcut Ctrl+Shift+Esc. Immediately after pressing these keys, the task manager will launch. Or use the keyboard shortcut Ctrl+Alt+Del, as a result a window will appear. In this window, select “Task Manager. After launching the task manager, go to the “Performance” tab. In the top left corner of the window there will be a "CPU Usage" section. Information about the current load on your processor will be displayed there.
If you want to learn more about processor load, then you need to use additional programs. Search the Internet for TuneUp Utilities. If you do not want to pay for a license, then download a trial version with a limited period of use. Install the program on your computer.
Launch it. When TuneUp Utilities is launched for the first time, it automatically scans the system. Wait for it to complete. After this, a dialog box will appear asking you to optimize the system and fix errors. Agree to this operation. After its completion, you will find yourself in the main menu. Go to the "Fix problems" section and select the "Show running processes" option.
Information about the total processor load will be shown at the bottom of the window. The window will also display a complete list of running processes. Next to each of them it will be written how many CPU resources it uses. This way you can see which processes are using the most on your CPU.
If in idle mode the load on the processor is more than 10% percent, then this means that some program is running in the background and using its resources. You can find this program in the list, and if it is not in great demand, then simply remove it or remove it from startup, thereby relieving the extra load on your processor.
Rate the article!
imguru.ru
How to load the processor to 100% to check the temperature
You need to load your computer's processor to 100%! For example, it is necessary to test it under extreme conditions, or check how effective the cooling system is and how it copes with overloads. There are two ways. The first is to download and install a special program like CPU Stress Test (CST). And the second is to load the processor yourself, using only the Windows operating system. I’ll tell you about this scenario now!
In order to accomplish our plans, we only need a standard Windows notepad. Open it and write:
While TrueWend
It looks like this:
Let me explain a little - we have written program code that will launch a simple loop from the While loop for the standard Visual Basic handler. Now you need to save the file:
Yes, not just, but with a different extension. To do this, in the “File name” line you need to write its name “loop.vbs”.
Please note that the file name must be specified in double quotes in the line. Otherwise, it will have a .txt extension, but we need it to be .vbs. The result should be a file like this:
To load the processor to 100%, you will need to start it. But first, open the task manager on the “Performance” tab:
The CPU load graph is displayed here. Since now most modern processors are multi-core, in order to load it to the maximum, i.e. 100 percent, you need to see all the cores. To do this, right-click on the graph and select the menu item “Change graph”>>”Logical processors”. I got it like this:
You may have more or fewer graphs depending on the CPU model. Well, then, in order to load the processor as much as possible, you need to load each core. To do this, run our cunning script several times in turn and look at the result in the graph.
After the required result has been achieved, it will now be necessary to do the opposite - to unload the system.
To do this, there, in the Task Manager on the “Processes” tab, find each “Microsoft Windows Based Script Host” task and uncheck it.
This is also interesting:
set-os.ru
How to check the load on a video card?
The computer constantly has the ability to monitor CPU and RAM load, and you can also view which process is loading the system.
To do this, simply load the task manager and go to the required tab. But with the load on the video card, everything is a little more complicated, and next we will look at how to check the load on the video card. You may need to check the load on your video card for several reasons. For example, check how loaded the video card is during a game or why the video card is loading when idle. Checking the load on the video card during idle time is quite simple. To do this, you need to install some simple program, GPU Temp or TechPowerUp GPU-Z.
Sometimes, along with online games, a miner program can be installed like a virus. It does not start right away, so as not to be detected. While running, this program loads the video card. If such a problem is discovered and confirmed, you need to find an unfamiliar process in the task manager that is slightly loading the processor, stop it and delete the file that is being launched.
It is a little more difficult to see the load on the video card during a game, since it is desirable to display all the information on the screen during the game. To carry out such a download, a combination of programs is most often used, MSI Afterburner and Rivatuner Statistics Server. Both programs are installed immediately when you install MSI Afterburner.
After installation, the application is launched with a not entirely informative skin.
One of the first interfaces will be much easier to understand. Everything is easy to change in the settings.
To configure the display of data on the load of the GPU, memory and other data on the screen during the game, go to the settings and go to the “Monitoring” tab. Here we see a list of “Active monitoring schedules”. In this list, you need to select each parameter individually that we want to observe on the screen, and enable its display by checking the “Show in Overlay Screen Display” checkbox at the bottom.
But the customization doesn't end there. All this information will be displayed on the screen by the Rivatuner Statistics Server program, which also needs to be configured. By default, the program is already set to show all the data in the upper left corner, and you just need to make sure that everything is turned on. If desired, you can only change the location of the displayed data and the text size.
These settings are made literally in a minute, after which you can launch the game and view the parameters in real time.
This method has one big drawback: the Rivatuner Statistics Server program loads the video card quite decently, and if during the game you need to get the most out of the video card, monitoring programs need to be disabled.
The processor is heavily loaded: what to do?
Is your processor constantly loaded and your computer or laptop slowing down a lot? And at the same time - in idle mode? High CPU (central processing unit) load is one of the most common problems today. And PC and laptop users constantly encounter it.
Luckily, she has a solution. And not even one. Therefore, below are the most effective recommendations that will help you understand why the processor is loading and how to reduce CPU load.
These tips are universal, so you can apply them on Windows 7, 8, 10 and XP. The processor model on a laptop or computer doesn’t really matter either.
The content of the article:
What program is loading the processor?
First you need to launch the manager and see what percentage of the processor is loaded on your PC. To do this, press Ctrl+Shift+Del and pay attention to the item “CPU Load” (it is located at the bottom).
In principle, this value can jump. But not much. For example, the Core i5 loads 2-8% in idle mode (or with the browser turned on). And this is the norm. Although on weak processors (for example, 2-core Core 2 Duo), the load may already be 10-20%. It all depends on the specific CPU model installed on the computer or laptop.
If the processor is loaded at 50 or 100 percent, then this is clearly overkill. To see why Windows 7 is using so much CPU, go to the Processes tab and then click on the CPU field. This will sort the list in descending order.
In the screenshot below you can see that only the Flash Player plugin is loading the CPU (due to the browser being enabled). But not much, so in this case it is not critical.
By the way, quite often the following situation arises: you were playing a game or working in a program, and after a while you closed it. But the process itself may still be active. It turns out that you no longer play or work, but the program still loads the processor. In this case, you need to go to the manager and manually end the process. Or just restart your computer.
Also, be sure to pay attention to unknown processes due to which the processor is loaded at 50 percent (or higher). Especially if you see them for the first time, and they load the CPU by at least 20%. It is quite possible that these are viruses.
What to do if the processor is loaded for no reason
Didn't find any processes in the manager, but the CPU is still heavily loaded when idle? To get started, you can click the “Display processes of all users” button. This usually doesn't help, but it may add new items to the list.
And to display all the processes that are constantly using the CPU, we recommend using the free Process Explorer program. It's very easy to use:
- Launch the utility.
- Click on the "CPU" column to sort processes in descending order of load.
- See why the processor is heavily loaded.
The screenshot above shows that the Interrupts process is to blame. It is this that loads the processor by 18% when idle. Although it can load 50 and even 100 percent!
Fixing a problem like this is extremely difficult. This is because such a high CPU load can occur due to:
- drivers on a computer or laptop;
- viruses;
- incorrect operating mode of the hard drive;
- problems with peripheral equipment (printers, scanners, HDD drives, etc.).
Most often, heavy CPU load occurs due to drivers. To check this, go into safe mode and see if there is any load on the CPU. If not, then most likely the problem lies in the drivers.
The easiest way to fix it is to reinstall Windows 7. And then install drivers on your computer or laptop one by one and check the CPU load after each of them. This way you can quickly find the culprit.
Usually this problem appears due to universal Microsoft drivers, which are installed immediately after installing a new Windows. In this case, it is better to find the necessary drivers yourself at the office. manufacturer's website and install them. Read more about how to do this here:
How to find drivers for a laptop?
Programs for automatically searching and installing drivers
If you suspect the presence of viruses, you need to install any antivirus on your computer and run a scan. If you don't know which one to choose, look here: the best free antiviruses for Windows.
It would also be a good idea to use special utilities to search for malware and advertising viruses (adware, malware).
Read more about this here: How to check your computer for malware?
Incorrect operation of the hard drive can also cause the process to be heavily loaded. Especially if it works in PIO mode (DMA mode must be set). This must be checked and corrected if necessary.
Read more about how to switch the mode here: The hard drive is slowing down: what to do?
And the last reason why system interrupts and high processor load occur is problems with printers, scanners and other peripheral equipment. To check this, disconnect all devices and leave only the mouse and keyboard.
Also go to Start - Control Panel - Device Manager and see if there are devices here that have a yellow exclamation mark next to them. Its presence indicates that the equipment is not working correctly and the driver needs to be updated (which is what needs to be done).
CPU is always 100 percent loaded in Windows 7
There is another fairly common problem that often occurs on Windows 7. It is that on many PCs and laptops the processor is constantly loaded at 100 percent when idle (that is, even on the desktop). And if you open the task manager, you can see the svchost.exe process there, which is duplicated several times.
The reason here lies in the automatic updating of Windows 7. The fact is that updates are now released only for Windows 8 and 10. For Windows 7, they, of course, are not suitable, and therefore do not work correctly. It is for this reason that on Windows 7 the processor is loaded at 100 percent.
To fix this, you just need to turn off automatic updates. For this:
- Go to Start - Control Panel - Update Center.
- Click on the “Settings” line.
- Select "Do not check..." and click "OK".
- Restart your PC or laptop.
After this, the svchost.exe process should disappear, and with it the CPU load should decrease.
Signs of a bad video card.
The first thing you need to pay attention to when the video adapter fails is the presence of various artifacts on the monitor. As described above, artifacts can appear as dots, twitching, the presence of squares of a different color, or half of the monitor screen changes color and then returns to its original colors.
To try to get rid of such symptoms, you need to inspect the cooler, whether it is spinning or not, clean the radiator, and update the drivers. Check to see if the capacitors are swollen, and if they are swollen, unsolder them and replace them. If all else fails, you should try to warm up the video card processor, as there is a possibility of it moving away from the board.
If the image is doubled or distorted when playing, then the graphics processor or video controller may be almost out of order. You should check the video card on another computer and also test the cable connections. Perhaps they are not pressed tightly against the interface.
If the image does not appear on the screen, but the computer is already running, and the monitor definitely has nothing to do with it, the video card is most likely burned out. However, you shouldn't throw it away right away. You need to clean the interface contacts with an eraser and try to turn it on on another computer.
The BIOS will also emit certain signals when turned on if the video card is faulty. Usually these are eight short beeps.
If you buy a used video card, you need to pay attention to the price. No one will sell a good card cheaply, even if it was used.
Before purchasing, you must use special programs and check it immediately on the spot. So that you don’t have to pay for repairs or buy a new one later. How to do this will be described below.