Process Monitor 3.01
Many people are interested in the question “How do I find out what a program does when installing, starting, closing, running?
How can I follow the program? Answer: Using another program called Process Monitor. Process Monitor is a program for Windows that shows in real time where files are written or deleted from, which files are read by a particular program, what actions the program does with the registry, how and when the monitored program uses the network (Internet), and also monitors processes and threads. The program is equipped with a powerful filter to track the necessary processes or events. Process Monitor is the main tool for troubleshooting system problems and getting rid of malware (viruses).
Now let’s take a closer look at how to work with the program and analyze its key functions. For a more detailed introduction to the program, see the “video” column on the right, since a complete description of the program will require writing a book).
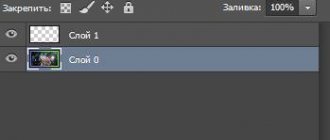
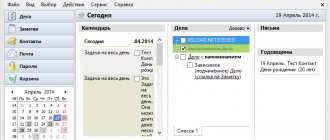
This is what the main program window looks like when you start Process Monitor. Immediately after startup, recording of Windows processes begins: accessing and creating files, accessing the registry, network, etc.
Of course, a very large amount of information is recorded at once, and it’s not very easy to find what you need in it, but here filters will come to our aid, but we’ll first look at the program interface a little later.
On the main program panel:
Its main functions are posted. Rightmost group of icons
These are the preliminary (coarse) filtering icons. From left to right: show access to the registry, to the file system, to the network (Internet), show processes and threads, profiling for each process. Accordingly, if you select one icon, for example, an access to the registry, then only the access to the registry will be shown, if there are two, then two, etc. I note that even if you do not select any icons, recording still continues and if you turn it on, events before it was turned on will be shown.
The next two points are search and transition:
Accordingly, if you click search, a window will appear where you will need to enter a phrase or parameters, and if you click go, an explorer will open, if you look, for example, what kind of file is being created or the registry editor, if you look at what registry parameters are changed or read.
Next menu group filters
The first item is the filter itself; when clicked, a window will open where you will need to select filtering parameters. The second point is highlighting certain lines, i.e. It’s also a filter, but it simply selects the necessary data. The third point “sight” is needed to quickly add a process if you don’t know what it’s called. For example, some window has opened, but you don’t know what kind of window it is, click on the crosshair and hold it, dragging it onto the window that appears, a filter will be automatically created that will monitor this process.
The next menu group is responsible for displaying events in the main window
Magnifying glass is stop and start tracking. The list with an arrow automatically scrolls when a new entry appears. And the list with an eraser is to clear the list of events that are displayed on the tap.
The last two menus, I think there’s no need to explain much about saving or loading traced processes
You can save, for example, if you want to parse the data on another computer.
Now let’s look at how the program works using an example. Let's say we want to find out what some application is doing on our computer. Let this application be a notepad. In processes, we know in advance that it is called notepad.exe. Launch Process Monitor, press the “Filter” button (Ctrl+L) and see the following window:
By default, it already includes several filters that exclude from the list various kinds of system processes, processes of the Process Monitor program itself, and others that are usually not needed for analysis.
Let's create our own filter that will show only the notepad.exe process. To do this, click the first down arrow, where “Architecture” is written by default and select “Process Name” from the proposed list. Fig. 1. Next, from the second list, select the “is” item, which is the default Fig. 2. In the next menu we can select a process from those already running or add it ourselves by writing “notepad.exe” in the field. We haven’t launched the notepad yet. Let’s write it ourselves. Fig.3. The last point is how to position this process “Include” to leave only it, and “Exclude” to exclude it from the general flow. Select “Include” Fig.4. Click the “Add” button below to add a filter.
As a result, we should get the following:
We click “Apply” “Ok” at the bottom and we see that the list in the program has become clear, this is because we enabled the filter for a process that is not yet running and added a condition to ignore everything except this process.
We launch notepad and see the following:
The first line we see is the launch of the process with PID and Parent PID, then a thread is created, graphic files are loaded, a file is created in the C:WindowsPrefetch folder and named NOTEPAD.EXE-D8414F97.pf. We can immediately go to this folder; to do this, just highlight the fifth line in this case and click on the green arrow on the main panel, and the folder in which this file was created will immediately open. Next comes loading various system libraries, reading settings from the registry, both system and user, and much more.
There is another icon on the main menu that was not mentioned before: This is the process tree icon. If you click it, you will see the following window:
This tree shows which program, which process was launched, the folder where it was launched from, how long the process lived and a lot of different information.
That’s all, as I already said, to show everything will require writing a whole book, so watch the video on the right; it tells more and also shows it).
Comments on the above are welcome.
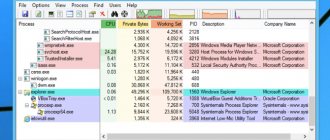
Process Monitor Columns
The columns that are present by default in the Process Monitor interface contain a ton of useful information, but you'll definitely need some context to understand what data each actually contains, because some of it may look like something bad happened when they are truly innocent events that happen all the time when the operating system is running. Here's what each of the default columns is used for:
- Time - This column is self-explanatory and shows the exact time the event occurred.
- Process Name - The process name is the process that created the event. By default, the full path to the file is not displayed here, but if you hover over the field, you can see exactly what process it was.
- PID —Process ID—identifier of the process that generated the event. This is very useful if you are trying to understand which svchost.exe process generated the event. This is also a great way to isolate a single process for monitoring if it doesn't restart.
- Operation - The operation is the name of the operation that is logged, and there is an icon that corresponds to one of the event types (registry, file, network, process). The names RegQueryKey or WriteFile can be a little confusing, but we'll try to help you figure it out.
- Path - The path is not the path of the process, it is the path to what the event was working on. For example, if the WriteFile event occurred, this field will display the name of the file or folder with which data was exchanged. If this was a registry event, it would show full access to the key.
- Result - Shows the result of the operation, which has the code SUCCESS (success) or ACCESS DENIED (access denied). While you might be tempted to intuitively assume that BUFFER TOO SMALL means something really bad has happened, in most cases this is not the case.
- Detail - Additional information that is often not used in the normal troubleshooting world.
You can also add some additional columns to the default display by choosing Options → Select Columns. This isn't a primary requirement when getting started with the program, but since we're explaining columns, it's worth mentioning.
One reason to add additional columns to your display is that you can filter out these events very quickly without becoming overwhelmed with data. Here are a few additional columns that we use, but depending on your situation, you may find use for other columns in the list.
- Command Line - Although you can double-click any event to see the command line arguments for the process that generated each event, it can be useful to quickly view all the options.
- Company Name - The main reason this column is useful is that you can simply quickly exclude all Microsoft events and narrow your monitoring to everything else that is not part of Windows. (You should make sure that you don't have any strange rundll32.exe processes running using Process Explorer, as they could be hiding malware).
- Parent PID - This can be very useful when troubleshooting a process that contains many child processes, such as a web browser or an application that keeps running sketchy things as another process. You can then filter by parent PID to make sure you're capturing them all.
It's worth noting that you can filter a column's data even if the column isn't visible, but it's much easier to right-click and filter than to do it manually. And yes, we mentioned filters again, although we haven't explained them yet.
Studying a Single Event
Viewing objects in a list is a great way to quickly see many different data points at once, but it's definitely not the easiest way to examine a single piece of data, and there's so much information in a list. Luckily, you can double-click on any event to access a treasure trove of additional information.
The default Event tab gives you information that is much like what you saw in the list, but adds a little more information about the party. If you view a file system event, you will be able to see certain information such as attributes, file creation time, access attempts during a write operation, number of bytes written, and duration.
Switching to the Process tab gives you a lot of useful information about the process that created the event. While Process Explorer is typically used to work with processes, it can be very useful to have a lot of information about the specific process that generated a particular event, especially if it is something that happened very quickly and then disappeared from the list of processes. This is how data is collected.
The Stack tab is sometimes extremely useful, but often it is not at all useful. The reason you should look at the stack is because for troubleshooting you work in the Module tab for anything that doesn't look quite right.
As an example, imagine that a process is constantly trying to request or access a file that doesn't exist, but you don't know why. You can look through the Stack tab and see if there are any modules that don't look right, and then examine them. You may find that the problem is due to an outdated component or even malware.
Or you may find that there is nothing useful for you here, and that's okay too. There is a lot of other data to look at.