Visualization of information significantly increases its perception. The Word editor from the well-known Microsoft corporation has all the necessary tools for creating graphs. The creation of graphic data directly depends on the version of the editor used.
How to draw a graph in Word
Graph in Word 2020. Step-by-step instructions
The 2020 Microsoft Word interface is maximally optimized for the end user. The algorithm for creating graphs is as follows:
- Open Word.
Open Word
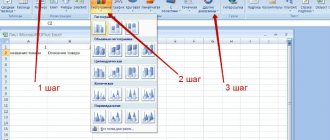
- Left-click on the “Insert” tab, which is located to the right of the “Home” tab.
Left-click on the “Insert” tab
- Click on the “Diagram” button.
Click on the “Diagram” button
- A window appears with a choice of possible options for visualizing the diagram. Select "Charts".
Select “Graphs”
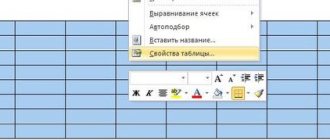
- The system will open an additional window with data that can be changed. Please note that an Excel table has opened. This editor is responsible for tabular data. The horizontal axis has the standard name “Categories”, the vertical axis – “Rows”. The name can be changed. In addition, additional axes can be added.
In the Excel spreadsheet editor, change the data to your own
- After entering the necessary information, the schedule will be created automatically.
The information entered in the table will automatically be displayed in the graph
On a note! The editor gives you a choice of the appearance of the graphs. It all depends on the user's needs. The desire to visually highlight specific data can easily be satisfied by a graph with markers, or to display growth - a stacked graph.
The created graph can be changed at any time; just select the area of interest and click the right mouse button. It is possible to change both the initial information and the color scheme:
- The chart's position in the document is changed by changing the legend format. To do this, right-click on the chart and select “Legend Format” - “Placement”;
Right-click on the chart and select “Legend Format”
Mark the appropriate item to place the legend
- The size of the chart changes as follows: grab a corner of the chart with the left mouse button and “drag” it either to the center (zoom out) or to the edges of the screen (zoom in);
Left-click a corner of the graph and drag to resize the graph
- The color of the lines changes by right-clicking on them.
The 2020 version of the text editor has transformed the graphics from a visual point of view (the lines have become smoother, the overall picture has become more elegant and presentable), but the general principle of construction remains the same. And this is important to understand when working with older Microsoft products.
How to create a function graph
If you need to insert it into a document, then you can proceed as follows. First, add a function graph in Excel, I explained how to do this in a separate article, and then copy and paste it into a Word document. After this, you will still have the opportunity to edit it in Word, as described above: either click on the axes, or go to the “Working with Charts” tab.
How to create a function graph using the constructor
If you need to insert it into a document, then you can proceed as follows. First, add a function graph in Excel, I explained how to do this in a separate article, and then copy and paste it into a Word document. After this, you will still have the opportunity to edit it in Word, as described above: either click on the axes, or go to the “Working with Charts” tab.
You can also find various programs on the Internet that can be used to create a graph of a function in Word. I’ll tell you about one of them – “Chart Builder 1.50”.
This is a macro that needs to be installed on your computer. Then open Word and launch the program in “Add-ons”.
I downloaded the installation file from the Internet. Then I launched the installation wizard.
There is nothing special about the installation. Select your language, accept the terms of the license agreement, and click Install.
In order for the macro to work, you need to slightly change the Word settings. Go to the “File” tab and click on “Options”.
In the next window, go to the “Trust Center” tab and click on the “Trust Center Settings” button.
On the Macro Options tab, check the Enable all macros box. Click "Ok" in this window and in the previous one.
If you do not plan to constantly use this macro, then, after working with it, go back to the “Options” of Word and return everything back.
If you had a Word document open at the time of installing the program, then close it and open it again.
Then go to the Add-ons tab. A new icon corresponding to the macro should appear there. To run the macro, click on it.
The program interface is in Russian. Enter your values and draw the desired function.
I hope, using my recommendations, you were able to add either a regular graph or a function graph to the document.
How to graph a function by points in Word
Let's create a new document ( File - New - New Document - Create ).
This is interesting: What kind of program is Unity Web Player, installation method, removal, description of how the extension works
To draw a graph by points, it would be nice to use a grid. Let's turn it on.
On the View in the Show , check the box next to Grid . Now it will be much easier to draw coordinate axes and the graph itself.
Drawing coordinate axes
On the Insert the Shapes-Lines section, select Arrow . The cursor will change to a cross. With the left mouse button pressed, stretch the arrow to the desired length.
When a shape is selected, there are circles at its ends. By dragging any of them while holding down the left mouse button, you can change the length or direction of the arrow.
To draw the second axis, follow the steps described above.
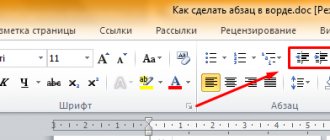
Next, we define a single segment on our grid and designate it using an inscription (Insert – Inscription – Draw an inscription) . Stretch a small rectangle and enter the number 1 into it. Now remove the fill and outline from the inscription (the Inscription should be selected). In the menu ribbon, select Drawing Tools – Format and in the Shape Styles , select for Shape Fill – No Fill , and for Shape Outline – No Outline . Now the outline and fill will become transparent.
All that remains is to move the number closer to the desired location.
If you copy this inscription and paste it several times, you can, by replacing the 1, label the coordinate axes, indicate the origin of coordinates, and place several more values on the axes.
Well, here the coordinate plane is given.
Draw a graph of the parabola y=x2
In the shapes, select Curve and on our coordinate plane, with one click, make the first point (-3,9), the next click at the point (-2,4), the next at the point (-1,1) and so on. Double-click on the last point to complete drawing the curve. It is advisable to try to place all the necessary points on the graph in one pass.
But if it doesn’t work out, it doesn’t matter, everything can be fixed. Right-click on your curve and in the context menu select Start changing nodes .
Your anchor points will be available for movement, and you can adjust the curvature or length of the curve. Using the context menu for a curve, nodes can be added or removed.
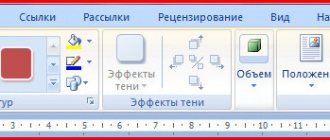
You can change the color of the graph and its thickness in the Drawing Tools – Format and in the Shape styles .
Remember! Grid mode applies to all pages of the document. After turning it off, the grid on the chart will also disappear.
Advice! Make graphs in a separate document and insert screenshots into the target text. This will give you the opportunity to correct inaccuracies and change the drawing.
Now that the chart is ready, you need to take a screenshot of it and paste it into the desired document.
Graph in Word. Other versions
The only version in which creating a graph looks a little different is Word 2003. The whole process can be described in the following steps:
- Click on the "Insert" section, then select the "Drawing" tab and select "Chart".
Click on the “Insert” section, then select the “Drawing” tab, then select “Diagram”
- Right-click near the border of the chart that appears and select the “Chart Type” section.
Right-click near the border of the chart that appears and select the “Chart Type” section
- In the window that opens, change the type to graphic.
Select the “Graph” view
- Enter the required data into the table.
Enter the required data into the table
- The schedule has been created.
Microsoft's policy has always been aimed at accessibility and simplicity for the end consumer. Over the 15 years of Word's existence, the general principle of creating a visual display of data has not been touched upon, and therefore, having mastered at least one version, you can easily create graphs in other editors.
Find out detailed instructions on how to build graphs and charts in Excel from our new article.
Implementing the diagram
Word has a feature to embed a chart copied from an Excel file after pasting it into a text editor. In this case, the data of the “linked” chart will be automatically updated if adjustments are made to the Excel sheet.
- So, you should click on the border of the already drawn diagram that you want to copy, and then click on the “Cut” item from the toolbar menu.
- After this, you need to click on the area where it should be located in the Word file, and then click “Insert”. The saving process is carried out in the same way as in the previously discussed option.
- If necessary, you can create all kinds of graphic elements using “Smart Art”.
This concludes my material on creating a diagram in Word files, I hope you understand how to make a diagram in Word using a table. See you again on the pages of my blog!
Previous post How to count the number of characters in word?
Next entry How to put an emphasis on a letter in Word?
Related graphic: Become more productive with Word
The method will be useful if you need to frequently change the source data. Step-by-step instruction:
- Open an Excel table with the required data.
Open an Excel table with the required data
- Select the necessary cells from which the graph will be built.
Select a table or individual cells to plot a graph
- Select the “Insert” section and find the “Diagram” tab.
Select the “Insert” section, find the “Diagram” tab
- In the “Chart” tab, find the “Graph” icon and left-click on it.
Find the “Graph” icon and left-click on it
- Select the created graph. Just click on its border.
Select the created graph by clicking on its border
- On the Home tab, click Clipboard.
On the “Home” tab, click “Clipboard”
- Cut out the graph.
Left-click on the scissors icon
- Paste it in the desired place in the Word text file by clicking on the “Paste” icon in the “Clipboard” and selecting the appropriate paste option.
In the “Home” tab in the “Clipboard”, click on the “Paste” icon
We select the appropriate insertion parameter, when we hover over the icons with the mouse we read the name of the parameters
This method greatly simplifies working with graphic data. The clipboard allows you to save the elements you need and instantly move them from one text file to another. In addition, you can create visual elements in a text document directly from the Excel spreadsheet editor.
Video - How to create a graph in Word, Excel 2016
How to make a chart in Word using a table Word 2007 – 2013
To add a diagram, you can follow one of several paths:
- Implement the diagram
- Insert a chart associated with all values and text located in Excel spreadsheets.
To insert using the first method, click the mouse where you want to place the diagram. Then, you have to go to the “Insert” tab and press the confirmation key. As a result, the Excel e-book will open:
You can enter new data by clicking on the appropriate cells. Thus, the user can easily replace the name of the axis and legend. The next step comes down to clicking on the “Microsoft Office” tab (for version 2007) or “File” (in versions 2010 - 2013).
In the appropriate field you will need to type the name of the file, and then click “Save”. As a result, a new file containing the finished diagram will be visible on the desktop.
Just a moment, it might be useful for you to learn how to find the right word in Excel or how to distribute wifi from your phone to your computer.