Web browsers are used not only for viewing Internet pages, but also in the process of creating them. Each browser, including Yandex, is equipped with a special interface called “Development Tools”. With its help, users can view the HTML code of the page, monitor the process of all actions taking place on the website, and also view logs of errors that occur when running scripts. This article describes why this interface is needed, as well as how to open the console and developer tools in the Yandex browser.
How to open
In order to open the interface described above, users need to use the program control panel, as described in the instructions provided:
- Launch the Yandex web browser.
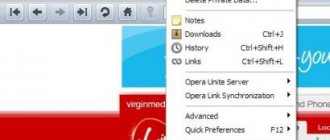
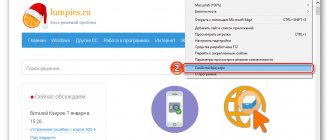
- Call up the quick access menu. To do this, you need to click on the button with the image of horizontal stripes, which is located at the top of the window, to the left of the “Collapse” and “Close” icons.
- Hover your cursor over the very last item in the drop-down menu that opens in your browser, which is called “Advanced.”
- In the new expanded list of additional functions, you need to find an option called “More tools”.
- Here users can choose one of three development tools: “View page code”, “Developer tools” and “JavaScript console”.
What is the “Browser Console” and why is it needed?
Before opening the developer console in the browser, you need to understand why it is needed and how to work in it. At first glance, it may seem that the developer panel is only useful to programmers or people involved in website creation. However, the tool will be useful for the average user as well.
Thus, the console can be used as a calculator . This function will be needed if the user cannot currently open the corresponding application for some reason. In addition, many people use a similar function to turn a regular page into a text editor . This way there is no need to search for a code snippet to fix it. You can edit the text directly on the page itself.
But the console is mostly useful for testing, finding and fixing script errors. There may be problems when launching or opening a web page. This is a common occurrence for people who create websites. All programmers know that it is impossible to write code without errors. But the page will not indicate what exactly the problem is, it simply will not be displayed . Then you should open the console. This is where any errors that occur will be described . Having studied them, the user has the opportunity to correct all problems.
The browser console is also useful for owners of online stores . With its help, you can determine which parts of the site have broken down and are no longer displayed.
What to do if the error “Unable to establish a secure connection” appears in your browser
The developer code can be placed anywhere on the screen . This function is convenient for those who often work with this tool. The user will be able to quickly find the section of code that is responsible for the output of various elements, or the desired effect.
The console will help present the page on any device , for example, on a smartphone or tablet. Therefore, you do not need to download additional applications to view the site on another gadget. If the page loads slowly enough, the user can find out which elements are preventing normal loading.
Hotkeys
You can also use hotkeys to access these menus in your browser.
- To view the page code, you must simultaneously hold down the “Control” + “U” keys (the letter “G” in the Russian keyboard layout).
- If you want to call the “Developer tools” toolkit, use the key combination “Shift” + “Control” + “I” (letter “Ш” for Russian input language).
- To open the console and see logs of errors in the execution of scripts written in the Java Script language, you must simultaneously hold down the key combination “Control” + “Shift” + “J” (Letter “O” for the Russian keyboard).
All combinations described above will work with any active input language and keyboard layout, as well as regardless of the enabled “CapsLock” mode, intended for entering capital letters.
The rest of the article briefly describes each of the tools and provides a small list of functions that may be useful to the average user.
Developer tools and console in the Yandex browser
Web browsers are used not only for viewing Internet pages, but also in the process of creating them. Each browser, including Yandex, is equipped with a special interface called “Development Tools”. With its help, users can view the HTML code of the page, monitor the process of all actions taking place on the website, and also view logs of errors that occur when running scripts. This article describes why this interface is needed, as well as how to open the console and developer tools in the Yandex browser.
JavaScript Console
In the console, users can see how certain scripts placed on the Internet pages they are viewing are executed in the browser. Web developers use the console to debug written scripts to see step-by-step how they work and how certain code steps are executed.
As a rule, for ordinary users the information displayed in the console is not particularly valuable, but there are situations when it may be needed. If you are getting error messages on a particular site and you cannot work with it, you will need to write to technical support to resolve the problem.
Very often, technical support staff may ask you to send a screenshot of the logs displayed in the console so that they can understand the problem. In this case, you can open this menu using the combination “Ctrl” + “J” + “Shift”, take a screenshot and send it to the site’s technical support mailbox.
Console Features
Web developers will find the console useful for a number of reasons, because it can be used to:
- monitor script performance;
- monitor all user actions on the site;
- find errors in the code.
For ordinary Yandex Browser users, this tool may not be in demand. However, in some situations, interaction with the console is still required. For example, if an error occurs regularly on the site or access to some page is stopped. In this case, the user can contact the technical support of the online resource, where he may be asked to provide screenshots of the logs.
View page code
This tool can be useful for people who want to learn HTML for hypertext markup. You can go to any page, find a specific element that you would like to learn how to create on your own, and press “Ctrl” + “U” to open a new tab containing the HTML code.
Thus, you get the opportunity to find out how the developers of this site designed this or that page, and what commands and tags were used for these purposes.
Opening the console in other browsers
First, it’s worth informing: do not try to use the same key combinations on different browsers. There have been many cases when users mistakenly deleted all their bookmarks, and getting them back can be quite problematic, and sometimes impossible. Therefore, below we will give examples of how to open consoles correctly.
Developer Toolkit
Development tools are a fairly complex service that is unlikely to be needed by those users who are not involved in creating, testing or debugging websites.
However, here you can find one useful function for those who order a website from any web studio. If you have ordered an informational website or catalog for yourself or your business, you will probably want to know how it will look on different devices and monitors.
Open this service using the key combination “Ctrl” + “I” + “Shift”, and click on the smartphone icon on the left side of the navigation menu. Here you can set any screen size and find out how different pages of your resource look on tablets, smartphones, laptops and widescreen monitors by adjusting the window size using a special grid.
Was the article helpful? Support the project - share on social networks:
Grade: 4,87
Description of developer panel elements
It's time to take a closer look at all the tabs in the developer console and their functions. A detailed description would take a lot of time, so we will briefly describe the role of each of them.
Developer panel tabs:
- "Elements" displays structured HTML code. It maintains precise code structure and nesting rules. In addition to the HTML code, the CSS styles for each block or element are displayed here. Allows you to understand the structure, see the classes of elements and the styles assigned to them;
- “Console” displays errors in the page code and allows you to run your own JavaScript code, which will be instantly processed in the browser;
- “Sources” is a tab that contains all the files with JavaScript and CSS code that are connected to the resource. Allows you to view both locally connected code and files hosted on other resources (this can be JQuery, Google metrics, Yandex and other theme files, scripts);
- “Network” is a very important tab, since we can use the information from it to increase the performance of the site. This displays the time it takes to load media content and external JS files. If the site uses high-resolution images or they are loaded from an external resource, the site will take longer to load. This tab shows which content causes the web resource to slow down;
- “Performance” is a page for checking the performance of a resource in detail. After the website testing procedure, statistics appear for each page element with complete information on loading speed;
- “Memory” is similar to the previous tab, but it displays information on page weight. We can expand the data and study in detail the weight of all page elements. Not only the weight of pictures or text is taken into account, but also all objects, HTML and CSS elements, etc.;
- “Application” provides access to all storage: cookies, cache, local storage, sessions, fonts, scripts and more. There is also a useful tool “Clear Storage”, it is designed to clear all storage;
- “Security” offers information on security certificates and connection reliability;
- "Audits" is a tool for quickly auditing a website. At the end of the work, the result is shown in 5 categories: “, “Ease of use”, “Best practices” (tips for improving the page) and “SEO”.
A couple more points:
Now we know why it is needed and how to open the console in the Yandex browser, and we also briefly became acquainted with the functions of each element of the developer tools. By fully using this development tool, it becomes possible to develop a website better and faster. For ordinary users, the console is useful for providing screenshots of site malfunctions and clearing temporary data.
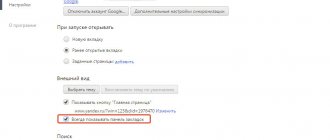
Hello, dear friends. The developer panel (console) in the browser is an indispensable tool for every website owner, with which you can quickly view the page’s html code and css styles. And also find out about errors that occurred when loading the site and check the site for adaptability.
Today we will consider working with html code, css styles and adaptability in the developer panel. These are the tools that are required to solve most problems.
For a general understanding of the picture, let's give an example when you might need the developer panel.
Let's say you came to my blog and you were interested in what font I use or color and so on. In general, this can be any element on the site. And you wanted to do the same on your website.
Then you look through the developer panel in the browser at the desired element, where you can see the html code and css styles for it.
Another option for using the panel is when you want to do something on the site, but don’t yet know what it will look like.
In this case, you can also use the developer panel and see how your idea will look in the browser. After all, everything you do in the developer panel is visible only to you. And in order for visitors to see your experiments, you will need to transfer styles and codes to the site files.
How is the Yandex browser developer console useful?
The developer panel is implemented to solve five main tasks:
- Debugging the website. Almost all sites have errors in the code, which are very difficult to visually identify, and even more difficult to find. This development tool shows all code errors and the lines where they appeared. Although the browser does not always indicate the correct line with the error, it at least approximately suggests the area for troubleshooting,
- Improving understanding of the site. To make a high-quality website that is resistant to all types of hacks, you need to gain a comprehensive understanding of the operating principle of a web resource. This section contains everything you need for an in-depth understanding of the structure of web pages,
- Testing the site for vulnerabilities. We can enter various commands into the JavaScript console, which are processed in real time. This trick is often used by hackers. At the testing stage it is precisely necessary to check resistance to such threats,
- View and manage connected, generated data. Among the developer tools we can find all cookies, session and local storage data. The function is useful mainly for testing, but sometimes deleting this data helps an ordinary user bypass a block, log out of an account, etc.
- A website audit is the final stage of testing before launching a web resource. The main task is to test the speed of the site. Another important role is determining how the site is displayed on devices with different screen sizes. From here we can see the appearance and behavior of the web resource on smartphones, tablets, mini-laptops and large screens.
Developer tools and the console in the Yandex browser are universal tools; they have everything a programmer needs and more.
Details
It is worth noting that initially this mode appeared in special builds of web browsers intended for extension developers, webmasters and other specialists. But over time, it migrated to regular versions.
Most users do not need this mode. They won't be able to use the tools because they don't even know what they're for. However, for some, this option is absolutely necessary.
Now we will tell you a little about the mode itself and show how to enable it. There is nothing complicated in the activation process itself. You just need to find the right parameters. But first, about the tools themselves.
Why do you need developer mode?
This mode is useful for extension creators and webmasters. It allows you to view the page code, edit it or change some properties. To use the tools you need to know the basics of coding. There is no way without this.
This is the mode that testers use when trying out new browser functions. However, they use test builds of web browsers (for example, Canary for Chrome). These tools are also very useful when designing a website.
Don’t forget those who regularly post content on their project. In some cases, they also have to resort to developer tools. For example, in order to edit CSS code or do something else.
In general, developer mode is used mainly by professionals. However, now we will talk about how to open the console in the Yandex browser and use the developer tools. We'll talk about this directly in the next chapter.
Enable developer tools
To solve our problem, we will have to travel a little through the web browser settings. All the necessary parameters and items are located there. The good news is that the settings are not hidden. No need to look for them.
And yet, the menu we need is hidden quite deeply. Beginner users are unlikely to find it. Therefore, we provide detailed instructions that will tell you how and what you need to do in order to succeed.
- So, first we launch the browser using the corresponding icon on the desktop, an icon in the Start menu or a button in the taskbar.
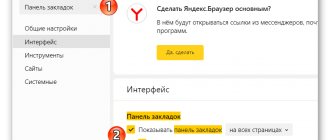
- Then click on the button with three horizontal stripes, which is located in the upper right corner of the main window.
- Now in the menu that appears, click on the item “Advanced” .
- Then in another menu select “Additional tools” .
- And finally, click on the “Developer Tools” in the next menu.
After this, the console will open and all the necessary tools will appear. As you can see, finding the right settings is not so easy. A novice user would get confused by the abundance of items and menus. But now you know everything.
You don't have to navigate through the menu to launch the console and open tools. There are special hotkeys that can open everything we need:
- To view the page code, press Ctrl + U.
- To launch the Java Script console – Ctrl + Shift + J.
- And the notorious developer tools are called up using the Ctrl + Shift + I .