Windows 7 Resource Monitor Overview Tab
The picture above shows the main Overview tab, which is very similar to the Vista monitor interface, except this time you can customize and save the display.
The most useful added feature was filtering. If you want to monitor only the data of certain processes, then you just need to select these processes from the general list. In addition to the fact that the data in the remaining areas of the window is filtered by selected processes (disk, memory, network), another orange line appears on the graphs on the right, which displays the occupied resources of the selected group of processes.
Windows 7 Resource Monitor also gives you additional process management capabilities (like Process Explorer). Right-click in front of the desired process and a context menu will appear with the following options: “End process”, “End process tree”, “Analyze wait chain”, “Pause process”, “Resume process” and “Search the Internet”. The “Analyze Wait Chain” option can be especially useful when debugging unresponsive or frozen processes.
Second option for launching resource monitor
Few people know (among novice users), but there is a much simpler way. You can start using Resource Monitor in Windows 7 using the standard Windows search component. The algorithm of actions here is even simpler.
- Open the Start menu.
- In the search bar (at the very bottom) enter “resmon”.
- Click on Resource Monitor in the search results.
- Let's start working with the component.
This is much faster than navigating through the Start menu directories. In general, for such a useful component it would be useful to create a launch shortcut on the desktop. However, let's move on to how to work with the resource monitor. Let's start with process management.
Windows 7 Resource Monitor CPU Tab
Most process monitors merge Microsoft services into a single process called "svchost.exe". So if you find that svchost.exe is putting a load on the central processing unit (CPU), it will be difficult to figure out who exactly is the culprit. This could be upnhost, WebClient, or one of the 10+ other services provided by svchost.exe (LocalService). But Windows 7 Resource Monitor can.
The services used table and graph in the CPU tab of Resource Monitor allows you to see what each process is doing. Similar to the behavior of the “Overview” tab, when selecting a process or processes, all data is filtered and an orange line is also displayed on the graph. In the services table you can stop, start, restart used services. Or, as a last resort, find information about resources on the Internet.
In addition, in the “Linked Descriptors” and “Linked Modules” tables you can see all used files, directories, registry keys and events, as well as find out which libraries are connected. The detail and control provided in the CPU tab certainly brings out the tool at its best. However, these tables are seriously lacking a number of functions, such as “Unload DLL”, “Close handle (handle)”, “Open in Explorer” and even the banal “Properties” item. Fortunately, this functionality is provided by NirSoft's free RegDllView (for DLLs) and OpenedFilesView (for open files).
Managing services using Resource Monitor
Let's continue to look at the "Resource Monitor" in Windows 7. How to use it if you need to disable some unnecessary services? In principle, the application can do this too. But here you need to be extremely careful. A seemingly useless service may turn out to be vital to the operating system. Therefore, you should not disable them all indiscriminately. The algorithm for disabling services using the “Resource Monitor” is quite simple.
This is how operating system services are managed using the Windows Resource Monitor. This method is much simpler and more visual than the option using the control panel and the “Administration” item. In addition, you can immediately see how much your computer’s performance has increased after disabling a particular service.
Resource monitoring
Resource Monitoring is a Windows utility from Microsoft that, as the name suggests, allows you to track in real time what is happening with resources in your operating system. Of course, there are alternative programs, both paid and free, and perhaps in the future I will write about them, but in this article we will consider the standard utility. There are several ways to launch Resource Monitoring. The standard way to start for all versions of Windows is to enter resmon in Run (Win + R keyboard shortcut):
It can also be found in the Control Panel in the Administration category: There are other options (for example, found in Start or in the Task Manager on the Performance tab in Windows 7 and higher), but the two methods above are quite enough. After launching the utility, you will see a window with tables, tabs and graphs. By default, the main tab opens - Review. It contains basic information on all other contributions, such as CPU (Central Processing Unit), Memory (meaning RAM), Disk and Network. By default, the CPU category is opened, which displays all active processes (similar to the tab of the same name in the Task Manager). Other categories can be opened by clicking on them. On the right are graphs for the above tabs. The CPU tab, as written above, is similar to the same one in the Task Manager. It also displays processes and Services, which can be seen by opening the corresponding category. The main difference (as well as additional features) are in the categories Linked Descriptors and Linked Modules. To see the information in them, you need to check the box next to the Process of interest. These same descriptors and modules are related files or entire folders that a given process uses: How can this be useful, besides the fact that you find out which files specifically are used by a given process? But at least the fact that when, for example, some program or game freezes on you (and this often happens in Windows), you do not close this very window with an error (remember where it says “the application is not responding” and asks for a report send or something like that), and go to resource monitoring, find this process on this tab (it will be highlighted in red), select it and find out what exactly is failing. Which file or folder exactly and where it is located. This is similar to working with logs, but they are not covered in this article. By the way, how else can you find out why the failure occurred? When you right-click on any process, there is an interesting item in the context menu - Waiting chain analysis...
It shows what is happening with this process. Either everything is fine: Or he's waiting for something: Or he's blocked: Or there's something else wrong with him. For example, the same case with freezing will show what’s wrong with it (you don’t even have to look below), accordingly, from here this very specific interfering process can be completed. By the way, this is also available on the Task Manager tab in Windows 8, as well as a lot of interesting things: I also want to draw your attention on this tab to the fact that you can add or remove columns for which information is displayed. This can be done by right-clicking on the name of any and selecting the appropriate item in the context menu: Thus, remove or add the ones you need specifically (for example, on whose behalf is it running or with what rights): The Memory tab shows more detailed information on the use of RAM (random access memory). In addition to how much is used and by what processes, as well as how much is free, you can pay attention to such pillars as:
- Page out of memory errors/sec. indicates a lack of RAM. The error may appear when the system is using a paging file on the disk. If you don’t know what this is, then read the article Too little virtual memory from which you will learn that if there are a lot of such errors, then you should increase the amount of RAM because It's not always good when a hard drive is used as this.
- Completed (KB) - This is how much memory (including the page file) is allocated to this process by the system.
- The working set (KB) is how much physical memory is actually used (the sum of the next two columns).
- Total (KB) is how much physical memory is allocated and can be shared with other processes.
- Private (KB) is the same as above, only the memory cannot be given away. There is also a bar at the bottom that shows how specifically memory is used in general: Reserved by hardware, In Use, Changed, Waiting and Free. You can find out more about them by hovering your mouse over: The Disk tab shows files that are currently using disks (on the Processes with disk activity tab). There's nothing unusual about the columns - write speed, and the higher the better. Disk Operation is essentially the same thing, only much more expanded and listing specific processes (remember that a single file can have multiple processes). The Response Time column is interesting here - if its value is more than 20 ms, then you should think about replacing the hard drive. Storage devices are all installed hard drives with their number, activity and location. The Network tab is practically the same as the previous one, only it concerns the network specifically (logical...). Processes with network activity are files that are currently using the network. Network activity, TCP connections and Listening ports - more details about the processes of these files that also use the network. I don’t focus on this because... I think that this tab in detail is needed only by system administrators, and they will be able to understand the categories. In conclusion, I would like to note that all columns are equipped with a tooltip that describes the purpose of each of them. Also, if you select a process with a “tick”, it will be shown (with all its processes) on all tabs and highlighted in orange. Resource Monitoring is a handy utility for very detailed viewing of the system state, but it is not suitable for everyone. For most cases, you can use the Task Manager, but still, if you want to scrutinize why the system speed has become low, or why the same file crashes every time, or why the Internet speed is low (as well as in many other cases) , then Resource Monitoring will help you.
Review of Overload Monitor - System Resource and Configuration Monitor
The Windows operating system works quite reliably. While she is alone on the computer. But as soon as programs from third-party Microsoft developers begin to be installed on the computer, various glitches and problems begin to appear. In severe cases, these problems result in a blue screen of death, which hardly makes anyone happy. The point here is not only that third-party program developers have crooked hands. The point is also the fundamental difficulty of taking into account all possible dependencies, nuances and features that arise during the operation of many programs installed on computers. Not a single person is able to take into account everything, which is why problems arise in the operation of the computer, which are expressed in freezing, braking, and so on. Someday patience runs out, and an inexperienced user solves the problem by simply reinstalling the system. For some reasons (the need to restore the entire set of programs standard for the user, the lack of a guarantee that the problems will not recur, and so on), this is not always a real way out of the situation. Sometimes it's better to figure out what the problem is. For such disassemblies, you need a program to monitor your computer in real time. For example, Overload Monitor from INIDIM Group.
Simple and functional program interface
Of course, Overload Monitor is not a program for everyone. This tool is primarily for system administrators, program developers and advanced users: for all those who need to monitor the operation of the computer in order to identify functioning problems and determine peaks in the machine's load. Overload Monitor is a small program that monitors the load on the processor, RAM, disks and summarizes load information in a single time log. One note: the program is only suitable for networks built on the Windows platform. For system administrators
The initial orientation of the program towards system administrators predetermined its feature of launching from any media: system folder, floppy disk, USB flash drive. In this case, the administrator does not even need to save the received reports to the same medium: they will be automatically saved in the specified network folder. This way, the administrator can have all the data in one place without much hassle: insert a flash drive, launch the program, run diagnostics and move on to the next workstation. (Let us only recall that a license is required for each of the computers being tested.) And the analysis can then be carried out in a calm atmosphere, without some accountant chirping in your ear: “And I also have here...” The reports themselves can be presented in the form of files in the format HTML, TXT, CVS. Choose the one that suits you. The report parameters are customizable, if you do not work with the program on different computers, but control only your own and only desktop/laptop, then some of the report parameters can be disabled so as not to fill your head with unnecessary information and your hard drive with duplicate information.
Configure reporting options
Collecting data about the software and hardware of a computer is an important component of the program for the system administrator of a large organization. There can always be an employee - an “advanced user” who wants to “upgrade” his own computer at the company’s expense, or, which is also undesirable, overclock the processor “for the sake of experimentation”, or install software on a work machine that is not needed for direct production activities. All this is easily controlled using Overload Monitor, the “System unit” and “Programs” tabs.
It is possible that a problematic situation may arise on a workstation when the administrator is not around. In this case, the employee does not even have to look for an administrator: the program provides the ability to notify a specific address when the processor is loaded for a certain period of time with a certain power. For private users
Quite often, the user has a situation where he cannot understand which specific running program is causing an increased load on the processor. Yes, such a load that it becomes simply impossible to work. Of course, you can use the standard “Task Manager” of the operating system, but this utility only shows the load on the processor as a whole and, in addition, does not keep a report. The Task Manager CPU usage screen does not have a time grid along its length and does not show which process caused the peak load. And Overload Monitor not only shows, but also creates a custom report on the work. True, Overload Monitor does not support per-core control of the load on dual-core processors, but it seems that situations when this is required are extremely rare.
Both the load level and the culprit of the peak load will show everything
In addition to monitoring processor load, RAM, running processes and disk operation are monitored. All this information is clearly presented in the system and program event logs, where even with a large number of events it is easy to find something that needs special attention. Such events are marked with a special icon. The only pity is that there are no such icons in the reports; you have to read the lines of the report looking for the words “Error” or “Warning”.
By performing periodic checks using this program, you can monitor the health of your computer and quickly notice emerging problems. If necessary, you can start the program automatically when the system starts. Summary
Overload Monitor is a utility useful for those whose work or hobbies require them to monitor the loading status of their computer. Keeping event logs, as well as a visual representation of the load level of the processor and all types of computer memory, will provide significant assistance in diagnosing the problem and will help make decisions on how to fix it.
View the cost and terms of purchase
How to end a process in the task manager if it does not terminate?
Hello everyone. Does it ever happen to you that you need to end some process, but you just can’t do it through the task manager? Common situation? Well, today we will deal with this matter!
But in what cases can such a situation arise? You know, I think that this kind of thing happens rarely with ordinary programs, but with all sorts of not very necessary programs it happens often. All these programs that are installed, so to speak, on your computer without your knowledge, all these programs do everything to make them difficult to remove later. And this is a process that cannot be completed, this is one of their tricks. It also happens that the files of such programs cannot be deleted, here I advise you to look towards the Unlocker program, it deletes non-deletable files, a suitable program. In general, guys, if you cannot complete the process or delete some suspicious folder or file, then it smells like a virus...
Speaking of viruses, do you think you don’t have them? No, I don’t want you to have them, but believe me, now there are such viruses... They can live for months and you won’t even know about it: not all viruses are interested in your VKontakte account, your mail, many are simply interested in the power of your hardware. To use a small percentage of this power for your own tasks.. After all, a small percentage is more difficult to notice.. Do you think it’s nonsense? No way guys! In short, this is all talk, I just wrote this to say that be careful (not only on the computer, but in life in general) and REGULARLY check your computer with these two FREE utilities: Dr.Web CureIt! and AdwCleaner. These are the best utilities, believe me!
So, let's get down to business, to end a process that does not end in the manager, you need to download the Process Explorer program. This is a free program and do you know why you can trust it? Because it's on the Microsoft website, so download it guys! When you go to the page, on the right side you will need to click on Download Process Explorer
So, have you downloaded it? Great! But you remember where you downloaded that. It’s just that Process Explorer DOES NOT INSTALL, it works like this, without installation, just launch it and that’s it! So, we launched it and this is the window that will open, this is what Process Explorer looks like:
Well, what can I say? Everything was done very cool, because it’s very convenient to see the processes, who started who, and a lot of information! In short, the program is super and it’s noticeable. It turns out that this is an advanced task manager! In this program, to end a process, you need to right-click on it and select Kill Process or Kill Process Tree. The first command simply terminates the process, while the second terminates the process tree. These are the points:
If you move the mouse to some process, you can also see interesting information in the tooltip like this (I brought the mouse to the svchost.exe process):
As you can see, there is nothing complicated, everything is simple and convenient. But you know what, I found another very important function here, of course I don’t know whether you need it or not, that is, whether it’s interesting or not, but I’ll show it to you, because it’s unique. In short, you can find out the service that launched the process, because some processes are launched by services, but not all! In any Windows there are several svchost.exe processes in the task manager, but they are launched by different services, that’s the funny thing! In short, to find out which service launched a certain process, you need to right-click on the process (I’ll take svchost.exe again as an example) and select Properties there:
A window will open, there will be all sorts of tabs, and there will also be a Services tab (if it is not there, then it was not the service that started the process), here is some information on it:
That is, it became clear that the svchost.exe process, on which we clicked and selected Properties, this process ensures the operation of the built-in Windows Defender. Well, this is how things are guys, I don’t know if this is interesting to you or not, but I had to show you this...
By the way, you can still put the process to sleep. Well, that is, stop it, so to speak, freeze it, to do this, right-click on the process and select Suspend. Then, to resume work, you also right-click and select Resume
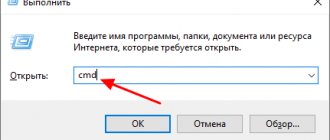
Now let’s return a little more to our topic, namely how to terminate a process that cannot be terminated in the dispatcher. The fact is that, in principle, this can be done without the Process Explorer program, but I’m not sure that this will always work. In short, look, hold down Win + R and write a command like cmd there and click OK:
Attention, guys! If you have Windows 10, then you need to right-click on the Start icon and select Command Prompt (Administrator)!
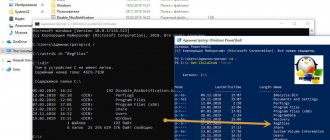
So, after this you will have a black window where you can enter different commands. Well, there is one command that can forcefully terminate the process, this command:
taskkill.exe /F /IM test.exe
This command forcefully terminates the test.exe process. It’s clear that where test.exe is, this is where you install the required process. You see, there is something like /F, /IM in the command, do you see? These are the launch keys. Now, if you add the /T switch, the command will also terminate all child processes. Here I have a process CCleaner64.exe (this is from the CCleaner cleaner), which I can easily terminate, so let me do it through this command. So I paste the command into the black cmd window:
Here she appeared:
Now I pressed enter and this is the result:
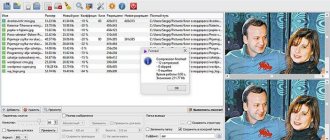
As you can see, the operation was completed successfully, everything is normal! We completed the process by its name, or you can also by its identifier, that is, by PID. But how do you find out this PID? Look, in the task manager there are some numbers next to each process:
Have you noticed this? Oh, they probably didn’t notice! Because this process ID column must be manually enabled, it is NOT SHOWED by default! But it’s not difficult to enable it; to do this, you need to click View at the top, and there will be a Select Columns item:
And that’s it, then you need to check the process ID (PID), click OK and you will also have such a column. Well, guys, in this column there is just such a thing as PID, that is, the process ID. To terminate a process by PID, you need to enter the following command:
taskkill.exe /F /PID 0000
Where 0000 is, then you indicate the PID of the process taken from the task manager. Well, I think it’s more or less clear to you, right? I sincerely hope so
Guys, I don’t know, but it seems like I wrote everything I needed, or did I forget something? I hope I haven’t forgotten, what else can I tell you? Don’t forget to regularly check your computer with antivirus utilities, especially since they are free. Which ones exactly? Well, I have already given the links above, if anything, then I’ll remind you, here is the first utility, and here is the second
Well, I hope that everything I wrote here is accessible to you and everything is clear to you. I wish you good luck, that you don’t get sick and that everything is fine with you
To home! task manager 12/09/2016
Taskkill - killing a process from the command line
In this video we will look at the Taskkill command, which allows you to kill certain processes from the command line in the Windows operating system. But first, as always, let’s look at why this might be needed at all.
On regular workstations, this command is not particularly in demand, since you can end the process through the task manager. Although, this does not always work out and in this situation the Taskkill command is useful, but this is rather an exception to the rule.
This command is mainly used by system administrators and I personally encountered the following situations:
1) Updating programs on the terminal server - when administering a terminal server, a large number of people can run the same application. But, in most cases, when updating a program, you must first close it, i.e. complete its process. If there are not many clients, then you can use the task manager, but if there are about 100 of them, then this is already problematic. And the Taskkill command allows you to kill all processes for a specific application.
2) Automatic restart of the program - as you know, not all programs work perfectly and sometimes they freeze. And if this program must work 24 hours a day and 7 days a week, then you have to periodically check its performance.
Personally, I came across the following situation: there is an online store into which product data is uploaded from 1C. But the handler is written somehow crookedly, as a result of which the exchange freezes once a day, or even every 2-3 hours. Therefore, it became necessary to forcefully restart the handler every hour, regardless of whether the program froze or not.
And so, let's move on to practice.
Let's launch the Google Chrome browser and try to kill its process (Start\Accessories\Run\cmd\taskkill/? - to see the command syntax)
/s COMPUTER, where COMPUTER is the IP or address of the remote computer. By default, the operation is performed on the local system. If this is what you are interested in, you don’t have to use this option.
/u DOMAIN\USER, where DOMAIN is the domain name and USER is the name of the user for whom you want to run the command. This option allows you to run taskkill with the rights of a specific account or domain.
/p - must be used in combination with the /u option to specify the password for the user account.
/fi - Allows you to run the taskkill command with specific filters.
/f - Forces completion of the command.
/IM - Allows you to use the application name instead of the process ID.
/T - termination of the process tree.
Now we need to find out the name of the application that uses this process. This can be done through the task manager (Ctrl+Alt+Del\Run task manager\Processes\chrome.exe).
If you do not have the opportunity to launch the task manager, let’s say you connected to the computer remotely via the command line, then you can use the tasklist command, it also displays all processes.
Taskkill /f /im chrome.exe – force termination of the application named chrome.exe
Chrome has completed its work, but there are errors "The process could not be terminated, no instances of the job are running." This message appears because these processes were connected and when the main one terminated, the others automatically terminated.
Now let’s launch Chrome under different users to simulate the operation of a terminal server. To do this, let’s launch it under a regular user and under an XP user (Chrome\Shift\RMB\Run as a different user\OK). Now we see that the same application is running under different users, we will repeat the Taskkill /f /im chrome.exe command to check whether the process will be completed for all users.
Now let's try to automatically restart the application, the task scheduler will help us with this (Start \ All Programs \ Accessories \ System Tools \ Task Scheduler \ Scheduler Library \ RMB \ Create Folder \ Restart Chrome - depending on your goal)
Create a launch task (Create a new task\Run\Run with highest rights\Trigger: scheduled, daily, starting at 11:00, repeat every hour indefinitely, enabled\Actions: launch the program, chrome\OK)
Let's create a task to terminate the process (Create a new task \ Terminate \ Run with highest rights \ Trigger: scheduled, daily, starting at 10:59:50, repeat every hour indefinitely, enabled \ Actions: launch the program, Taskkill, additional arguments: / f /im chrome.exe\OK)
Now let's launch Chrome and set the clock to a closer time to see how Chrome shuts down and then starts again.
However, sometimes it is necessary to prohibit only a process running under a specific user. This is exactly the situation I had with the 1C processor, which uploaded product data to the site.
The fact is that you can restart a frozen 1C every hour, but if you terminate all 1C processes, then all remote users will be logged out of it, and this cannot be allowed. Therefore, you need to terminate the process running under a specific account.
To do this, add the following line to the additional arguments /fi “username eq station-4-7” this command filters by user name and ends the process only of the one whose name matches the one specified in the filter.
Let's launch Chrome under a different user and see if the filter works.
With applications running on hardware, computer crashes and slowdowns are common these days. To deal with all these issues and monitor hardware resources, Windows comes with a great built-in tool called Resource Monitor. If you use a resource monitor, you can learn about its features and how it can help you monitor your computer's hardware resources effectively. But some users reported some problems with Resource Monitor. If Resmon or Resource Monitor is not working on your Windows 10/8/7 computer, this post will help you fix the problem. You may find that the Resource Monitor is not responding or that its window is empty, blank, or transparent.
Tools for monitoring internal computer systems
Most applications that offer component monitoring will have to be downloaded from the Internet. Unfortunately, Windows developers have not yet created a program that can relieve us of this need. However, there are some system applications that can provide basic information about your PC.
DirectX Diagnostic Tool
The DirectX Diagnostic Tool is a simple system program that checks your system, video, audio, and input hardware. Here you will find complete information about all devices connected to the computer. The main disadvantage of the application is that you can only see active devices, but not their status.
You can run the DirectX Diagnostic Tool as follows:
1. Open the Run using the Windows + R .
2. Type dxdiag and press Enter .
3. A program window will appear in front of you. If desired, you can save the received information by pressing the Save all information .
4. Specify the directory in which you want to save the file. By default it is named DxDiag.txt .
In our opinion, one of the most useful elements of this application is the option that displays the current BIOS version. It will be useful to users interested in updating it.
System Information
System Information is a utility built into the Windows operating system designed to display a complete list of devices connected to your computer. An additional feature of the software is scanning installed software, drivers and Internet settings.
How to open the System Information utility.
1. Open the Run using the Windows + R .
2. Type the command msinfo32 and press the Enter .
In the window that opens, you can find the following types of available information:
- Hardware resources.
- Components.
- Software environment.
Each section contains other subsections responsible for monitoring even minor components, such as “USB”, “Print” and “Modem”.
Select the desired option and check the status of the equipment you are interested in.
Task Manager
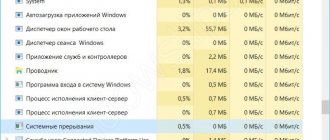
Task Manager is a system utility responsible for displaying all active processes on the computer. Using it, you can manage processes, monitor the performance of your computer, network connection and a number of other important nuances.
1. Use the key combination Ctrl + Alt + Delete to open the Windows menu.
2. Launch Task Manager . Usually the utility is located at the very bottom of the list.
Alternative launch method: key combination Ctrl + Shift + Esc . Not the most convenient, but it allows you to open the dispatcher instantly without performing additional actions.
How to check your computer's status using Task Manager:
1. Open Task Manager .
2. Go to the Performance .
3. Performance window will allow you to monitor in real time the performance of the central processor, RAM, hard drive, Internet and a number of other PC modules.
Speccy app
Speccy is one of the universal third-party applications for monitoring the health of your computer. A distinctive feature of the program is the ability to monitor the hard drive using SMART analysis. In addition, Speccy allows you to monitor the temperature of the central processor and video card, which helps prevent overheating.
The presence of all the necessary basic functions makes the program extremely useful both at home and at work.
Available Speccy functionality:
- Summary. Generalized information about all installed components.
- Operating System. System information is displayed here, such as the OS version, the platform on which it is installed, installation date, antivirus status, etc.
- CPU. Displays information about the computer's central processing unit. Allows you to see the number of available cores, manufacturer, device frequency, temperature and other information.
- RAM. Displays the number of memory slots, connection type, frequency and load in real time.
- Motherboard. Provides detailed information about the installed mother memory, including model, version, brand and connection type.
- Graphics. Status of the graphics card and monitor. Allows you to see the model, operating frequency of the device, monitor refresh rate and other useful information.
- Storage. Provides a detailed SMART analysis of the disk, allowing you to determine its current state and prevent failure as a result of damaged clusters.
- Optical Device. Information about connected optical devices.
- Peripherals. Information about connected peripherals (computer mouse, keyboard, etc.).
- Network. Network status information.
The wide functionality of Speccy and the simplicity of its interface make it easy to monitor the state of your computer without burdening yourself with additional theory about computer hardware.
AIDA64 program
AIDA64 is one of the best programs for monitoring the health of your computer. It allows you not only to see information about components, but also gives you the opportunity to test them. For example, with one of the tests, you can check memory reading, writing, copying, and memory latency.
AIDA64 collects all the best functions of monitoring programs and displays:
- Computer. Here you will find all the information about your PC, including temperature sensors.
- Motherboard. Get information about motherboard, SPD, chipset, BIOS and ACPI.
- Operating system. All information about the installed operating system. The list includes active processes, system drivers, services, AX files, DLLs, certificates, and OS uptime.
- Server. Section responsible for user information, security and shared resources.
- Display. Responsible for monitoring the video component of the computer. You can see the status of OpenGL, GPGPU, Mantle, Vulkan, fonts and other elements.
- Multimedia. Track information about audio components, drivers, video and audio codecs.
- Data storage. Get detailed information about the data warehouse. SMART disk analysis available.
- Net. Monitoring connection status. Starting from basic Internet settings on the computer to setting up the router and network resources.
- DirectX. Check the status of DirectX, video and audio.
- Devices. A section that allows you to check the status of all devices connected to your computer.
- Programs. Find out which applications are involved in startup, check the installed programs and licenses for them.
- Safety. Check the status of Windows antivirus and how safe your computer is against threats from the Internet.
- Configuration. Monitoring current Windows settings.
- Database. Contains information about drivers installed on the computer and their sources.
- Test. A section that allows you to run tests of computer components: reading from memory, writing to memory, copying to memory, memory delay, etc.
As you can see, the functionality of the program is really very wide and if you want to check absolutely every element of the operating system, it can take more than one hour. This is why AIDA64 is one of the most popular PC health monitoring applications.