GPU-Z is a simple and useful program that displays information about the GPU and its key properties. The utility is useful for beginners and experienced PC users to study the video card (or integrated GPUs) and monitor parameters in real time.
All images are clickable: to open them in full size you need to click on them.
The GPU-Z program will help: with overclocking (overclocking), selling and/or buying components, evaluating GPU performance.
Program description
The GPU-Z utility is freely distributed on the Internet by TechPowerUp (official website: https://www.techpowerup.com). The interface of the free program copies the style of the popular CPU-Z - a “monitor” of the central processor. GPU-ZET generates lists of data collected in 4 sections.
Information is displayed in English. Pop-up tips are provided in Russian: just move the mouse cursor to the line.
There is no “Russian version” of GPU-Z! Searching for and downloading such software will result in lost time or infection of your computer with viruses.
The program was created for Windows operating systems from Microsoft; You can download it on the manufacturer’s official website (without advertising and unnecessary “points” in the installer).
Functionality and capabilities
With compressed data delivery and a modest design, the GPU-Z utility is as convenient as possible. Half of the “categories” have annotations, and the rest can be learned from the text and video. Let's look at the tabs of the GPU-Z program.
Graphic Card
The tab opens by default upon startup and reflects technical information, aspects of the functioning of the GPU and its current state.
| Paragraph | Description | Why information is useful | Note |
| Name | Name of the model (Nvidia) or model series (ATI Radeon) of the video adapter. | Determining which GPU is actually running. Detection of a fake video card (in GPU-Z versions 2.11.0 and higher). | It is enough to see “FAKE” in GPU-Z and you can refuse the video card or demand a refund. |
| GPU | Chip name. | When comparing video card models, they will talk about performance. | |
| Revision | Processor revision number. | Chips of different revisions may differ in technical process, frequencies and temperature limits, supply voltage, and number of pipelines. | Needed to update the BIOS of the video card. |
| Technology | Technical process. | More modern GPUs have a lower number. | Affects the performance, power consumption and heat dissipation of the video card. |
| Die Size | Core area. | ||
| Release Date | Video adapter release date. | A new video card and a more productive one are two different things. | |
| Transistors | Number of transistors. | In combination with other points, GPU-Z will give an idea of the efficiency of the chip. | |
| BIOS Version | BIOS version of the video card. | You can save it to a file, then open it with a special program and “upload” it back. It is prohibited to carry out this operation without experience! | |
| Subvendor | Manufacturer's name. | Non-reference video cards differ significantly in build quality, cooling, and frequencies. | NVIDIA and AMD produce reference (standard) video cards, and then they are “finished” by MSI, Asus, Gigabyte, etc. |
| Device ID | Kernel ID. | For programmers. | |
| ROPs/TMUs | Number of rasterization and texturing units. | To compare the video card with similar GPUs from the company. | |
| Bus Interface | Supported interface. | The current (after the @ sign) and possible connection types are displayed. | GPU render test available to analyze PCI-E channel bandwidth |
| Shaders | Number of shaders | Has a positive effect on productivity. | |
| DirectX Support | Video card support for DirectX versions. | On old video cards, it will not be possible to increase the realism of the “picture” and see the beauty of the graphics of new games. | |
| Pixel fill rate | The number of pixels that a video card can “draw” and write to video memory in 1 second. | ||
| Texture fillrate | The number of pixels rendered by the GPU per second. | ||
| Memory Type | Video memory type. | Reflects the performance of the GPU. | This parameter of the video card is more important than the amount of its memory! |
| Bus Width | Data transmission channel width (bus width). | ||
| Memory Size | Video memory volume. | Games and resource-intensive applications require a sufficient amount of MB. | |
| Bandwith | Channel bandwidth between processor and memory. | ||
| Driver Version | Installed GPU driver version. | A fresh driver means productive and error-free operation of the GPU. | |
| Driver Date | Video card driver release date. | ||
| Digital Signature | Digital signature. | WHQL – good, Beta/Non-WHQL – doubtful. | WHQL – confirmation that the video card and driver will work stably in Windows. |
| GPU Clock/Memory/Boost | Current and set GPU and video memory frequencies in Boost mode. | ||
| Default Clock/Memory/Boost | Factory and standard GPU and memory frequencies for Boost. | ||
| NVIDIA SLI | Nvidia SLI/ATI Crossfire mode status. | Used to operate 2 or more video cards in conjunction. | |
| Computing | Technologies supported by the video adapter. | Various options help the GPU run faster in games and applications. |
GPU-Z 2.34.0 RePack by -ALEX-
Category:
Information and Testing, Additional software
Program version:
2.33.0
Interface language:
Russian / Multilingual
Platform:
x86 + x64
Developer:
TechPowerUp
Author of the build/repack:
-ALEX-
Medicine:
Not required (Freeware)
Description:
GPU-Z is a free program from TechPowerUp for displaying technical information about the video adapter (video controller/video card/video module), running under Microsoft Windows.
The program displays the technical characteristics of the graphics processor and its video memory, that is, it determines the manufacturer and name of the video adapter, the type of video processor and its characteristics, the size and type of video memory, the date and version of the video bios, the date and version of the video driver, and also shows the graphics technologies and standards supported by the video processor. The GPU-Z program can at the same time additionally determine the core temperature and frequency, video memory frequency and cooler rotation speed and conduct an online comparison of the device with other similar products. Key features:
Supports NVIDIA, AMD (ATI) and Intel video cards. Displays display adapter, GPU, and display information. Displays frequencies during overclocking, default and 3D (if available). Shows information about video memory size, bus width, and driver version. Reads data from various sensors installed on the video card (frequency, temperature, fan speed) and displays their values in real time. It has a built-in module for taking screenshots and saving them in GIF format. Has the option to check for new versions.
Changes:
v2.34.0 (September 7th, 2020)
Added support for NVIDIA Ampere (RTX 3090, RTX 3080, RTX 3070), GeForce GTX 1650 (TU106), GTX 1650 (TU116), Quadro T1000 GDDR6, Tesla V100-SXM2-32GB Added support for Intel Tiger Lake, Comet Lake (Xeon W-1290P, Celeron 5205U, Core i3-8140U), Ice Lake (Core i5-1038NG7), Whiskey Lake (Core i5-8265U) Added support for Apple Radeon RX 5700 XT & Pro 5700, AMD Radeon RX 350, Radeon E6465 Added die size for Intel Tiger Lake and Ice Lake Added support for DirectX 12 FL 12_2 Vulkan info in Advanced Panel now lists device extensions and instance extensions, sorted alphabetically Fixed memory overclock not showing on Navi when GPU clock at default Added support for GDDR6X memory Fixed crash during BIOS parsing on Ampere Do not calculate NVIDIA driver version number when Microsoft Basic Display Adapter driver active Advanced Panel entries will now properly reflow and wrap, when window width is changed
Features of RePack:
The program is Russified.
Sensors
The tab contains information about the operation of the GPU, which GPU-Z reads from sensors in real time.
- GPU Clock – video adapter core frequency.
- Memory Clock – video memory frequency.
- GPU Temperature – chip temperature.
- Fan Speed (%) – fan rotation speed in percentage terms.
- Fan Speed (RPM) – number of cooler revolutions per minute
- Memory Used – information about the used graphics memory.
- GPU Load – load on the video card as a percentage.
- Memory Controller Load – memory controller load level (%).
- Video Engine Load – video core load indicator (%)
- Bus Interface Load – bus load data (%)
- Power Consumption (W) – power dissipation in watts.
- Power Consumption (%) – power as a percentage of TDP.
- PerfCap Reason is a sensor for GPU stability, overheating, incorrect voltage, etc.
- VDDC – core voltage (in volts).
- CPU Temperature – temperature of the central processor.
- System Memory Used – the amount of PC RAM used.
All data can be saved in a log file:
Additional functions
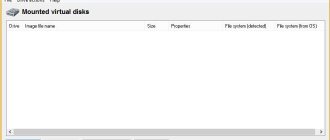
The GPU-Z utility allows you to:
- select a video adapter (when there are several of them)
Hurray, release! Oh, wait...
We postponed the release to the end of the first quarter, and literally a few days were not enough to meet the deadline. The benchmark must be done immediately with high quality, patches and versions 1.1.1., 1.1.2 must be released. There is no way: the results will “float”. The product must be immediately ready and stable. So that our engineers, vendor laboratories, and beta testers can test the benchmark to the maximum, we have moved the release to April 6.
On the morning of April 6, it turned out that the world was frozen in anticipation. “I took the day off on purpose because Superposition is coming out! When should I start downloading?” — wrote James from UK. “It’s already April 6th! Where is the benchmark? — Bruce wrote from the east coast of the United States. “I started this thread early because Superposition is coming out today. In the meantime, I’ll design the theme beautifully!” - they wrote on overclocker forums. "How are you doing? Soon? Will you write to me?” - James wrote again. Then Bruce. And Steve. And Marco. And several dozen more users through all possible communication channels.
A couple of weeks before the release date, we realized that we had underestimated the amount of work involved in launching a new website with leaderboards and the entire back-end associated with it. We chose the most critical thing: launching a new website with benchmarks, downloading from it, user authorization, a payment system, and most importantly, collecting the results into a database from which the tournament table will then be formed. Plus connect the front end with the back end.
We made a small but dramatic video about the evening of the first release attempt:
On the night of April 6–7, the Superposition benchmark itself was ready and hands were removed from it. But the part of the back-end and front-end that was critical for the release still refused to work as needed. By a strong-willed decision, the release was moved to April 11.
During these 4 days, the frequency of web commits tripled. Twice the hero of the detector and back-end, Tolya, went to the hospital as planned (not because of the release!), from where he did not stop committing, and only anesthesia stopped him. For an hour. Web programmer Lenya also stopped leaving work. QA stopped leaving.
Here we need to go back a little to the drama with Steam. The volume of distributed distributions on this release was significantly larger: the Superposition build weighed 3 times more than the latest Valley. And since then, there have also been more people wanting to quickly download the new UNIGINE benchmark. We counted on Greenlight and Valve servers, which would distribute the files without any problems. And they were not at all prepared to distribute a couple of tens of terabytes of traffic per day. Yes, we are aware of torrents, but a significant part of users do not use them for ideological reasons
We needed a quick solution so that everyone could download the long-awaited benchmark, so that our servers did not crash and so that it did not cost the company astronomical money. Sergey, our IT director, turned 10% gray while his department was looking for how to do this.
As a result, we came up with a scheme: buy a bunch of small hosting services for $5-10 and scatter our files across them. People coming for benchmarks should be redirected to these same hostings and mirrors in random order, and thus unload our servers. As a result, we made 11 mirrors for a budget of 3,000 rubles.
This is what traffic on just one server looks like on release night.
We distributed some of them from our servers with restrictions so as not to lie. Some came from mirrors that periodically fell and turned off. The second Sergei from the IT department wrote a separate utility of 150 lines of code, which monitored the state of the mirrors once a minute, turned off the “dead” ones, and when they came to life, included them back in the distribution.
In order to be in time for the release, we had to choose priorities: launch a new website, prepare everything for distribution of builds, set up the collection of user results into a database of future leaderboards.
Suddenly the demands from web developers dropped - we would like 32 GB of RAM on the server. All other UNIGINE web projects were not designed for highloading: each site required only a gig or two RAM. Therefore, the request for 32 GB of RAM for one site was extremely unexpected. The IT director turned another 10% gray, but still they managed to buy and configure the server in just half a day.
By April 11, we had the back-end and front-end critical for the launch ready. Before the sun had even risen over California, we had already completed the entire invisible part “under the hood”. And after the final tests and three “final” versions of the final build, on April 11 at 23:00, we uploaded Superposition. And finally we exhaled: the release happened.
Moving the release turned out to be easier than canceling the cake ordered in honor of it. So the cake arrived to us on April 7th. The team of artists is tired, but happy: their work on the project is definitely over.
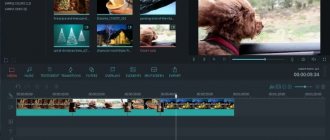
How to use the GPU Z program
To use GPU-Z, the program must be downloaded, installed and/or launched. All operations in the “shell” are performed with the mouse. The presence of hints in Russian simplifies working with the utility.
The purpose of the program is to check the characteristics of the video card and reflect the parameters of its operation.
It is impossible to spoil something: the GPU-Z program will not allow you to damage the video card.
Attention: the utility is not intended to test for hidden or manufacturing defects! The GPU-Z render test is not a stress test!
Advantages and disadvantages
GPU-Z is used by enthusiasts and casual PC owners.
Advantages of the GPU-Z program:
- The utility takes up only 6.3 MB;
- generation of reports and GPU parameters in real time;
- a comprehensive “set” of important data about the video card;
- free license;
- easy setup;
- a portable version of the GPU-Z utility can be launched from a flash drive;
- monitoring data during overclocking;
- constant updates and new features (monitoring of each fan of Turing video cards, expanding the list of sensors).
Disadvantages of GPU-Z:
- low information content and lack of a full FAQ;
- information about the GPU model is taken from the video adapter driver (not a 100% accurate method);
- lack of stress tests for the video card.
Reviews about the program
Eugene
I recently learned about GPU-ZET. I downloaded it and had to do some googling. When I decided to buy a video card secondhand, it came in handy. The seller tried to sell a fake GTX 1063 video card. I compared the data on the Nvidia website and the numbers in the program, and I understood everything. Now I always keep the program on hard.
Andrey
I seem to understand hardware, but GPU-Z made me want to learn more. I was able to understand everything about my card, and generally began to navigate the market. Now I don’t listen to salespeople in stores. A small program helped me improve my skill.
Victor
Along with the driver for the new video card, I downloaded an overclocking utility. I did something wrong, and then the computer rebooted in games. A friend advised me to look at the sensors in GPU-Z, and there was an error - high core voltage. I solved the problem, but left GPU-Z - simple even for a teapot, lightweight, runs on any computer.
Max
All important temperatures and cooler speeds are there, logs are written, new data about produced video cards is constantly being added, the interface is understandable even to a child. What else is needed?
Novel
The program does not load the system. All sorts of “bagels” and Everests are consumed exorbitantly. And here the responsiveness is good, and all the necessary parameters are right before your eyes. When I was driving my 980, I looked at the GPU-Z sensors and everything went fine.
Dmitriy
I am engaged in buying and selling used computers. The GPU-Z utility helps. I opened it, took screenshots in two clicks - and the buyer sees how the video card works, and I am calm. Comfortable.
Dry total
In fact, not all dramas are told in the post and not all heroes are mentioned. The whole saga would take a couple more posts. And, although there were some failures, you can’t just go ahead and not be proud of the results of the year of work that passed from the start of demo production to the release of the Superposition benchmark.
- We made the most beautiful benchmark in the world.
- The artists improved so much that they surprised themselves.
- Improved SSRTGI technology in the engine.
- The online service has finally been launched.
- We have learned to identify iron of all types much more accurately.
In the first 24 hours, we collected 13,000 results into the database. At the time of publication of this post, Superposition had been installed more than 100,000 times and the installation rate is stable. In total, the work was completed in 6,100 commits, 1,437 of them in the last 90 days before release.
The code is written (not counting engine modifications), in the lines:
- C++: 41952
- UnigineScript: 10000
- PHP: 69000
- JavaScript: 4000
The final assembly contains 900+ objects and 400+ textures.
7 RC versions collected. 1 burned in the name of video card release. And finally, on the day of release, a lot of reviews and articles about Superposition. All the world's top popular hardware portals wrote about the release of the benchmark, for example, Tom's Hardware, TechPowerUp, VideoCardz.com and the native IXBT. Video reviews from users and video bloggers began to appear.
You can judge the result for yourself by downloading Superposition. Despite the fact that at the highest settings the benchmark is capable of beating any modern system, thanks to different quality presets you can run it on a computer 4-5 years old.
Or take a look into the future of real-time 3D graphics by watching videos in maximum quality and 8K resolution. This mode is also in the benchmark, but not all top video cards can withstand it:
GPU Z analogs
Software developers and enthusiasts have released programs quite similar to GPU-Z. Free, shareware and paid analogues:
- AIDA 64 is a “station” for diagnosing and evaluating the operation of PC components; stress tests and sensor data.
- MSI Afterburner is a proprietary utility for video cards, overclocking them, adjusting cooler speed, etc.
- OSST is a professional program for monitoring GPU parameters, conducting load tests, and control.
- Furmark is a well-known utility for stress testing a video card with full GPU statistics displayed in the menu and on the screen.
GPU-Z 0.5.8 - with a new graphics test to accurately determine the number of PCI Express lanes
Updated utility for obtaining information about video cards, with traditional support for new video cards, as well as interesting new tests.
announcements and advertising
2080 Super Gigabyte Gaming OC for 60 rubles.
Compeo.ru - the right comp store without any tricks
RTX 2060 becomes cheaper before the arrival of 3xxx
Ryzen 4000
series included in computers already in Citylink
The price of MSI RTX 2070 has collapsed after the announcement of RTX 3xxx
Core i9 10 series is half the price of the same 9 series
The price of memory has been halved in Regard - it’s more expensive everywhere
List of changes in GPU-Z 0.5.8:
- A graphics test has been added that allows you to accurately determine the number of PCI Express lanes under load.
- Added a function for displaying the “quality” of the integrated circuit of NVIDIA “Fermi” and AMD “Southern Islands” chips (called from the GPU-Z system menu).
- Added support for new video cards: FirePro V7900
- GeForce GT 630M
- Radeon HD 6410D
- Radeon HD 6930
- Radeon HD 7690M
- Tesla C2075
- Crash on older ATI cards.
As the author of the utility explains, the PCI Express bus provides energy-saving mechanisms to turn off unnecessary lines during downtime and reduce the operating frequency. Therefore, GPU-Z may show incorrect PCI Express bandwidth values. You can determine the correct indicators under load; for this purpose, a graphics test has been created that switches the video card bus to the maximum operating mode.
To call up a graphical test, click on the question mark icon to the right of the field with the bus interface type. As you can see from the screenshot, multi-chip CrossFire and SLI configurations will require running in full screen mode. Please note that Render Test is not a stress test and cannot be used as a replacement for ATITool, GPUTool or FurMark.
GPU-Z is an analogue of CPU-Z for video cards, a free utility for obtaining accurate and reliable information about the video cards installed in the system, their characteristics and current operating modes. It has a simple but convenient monitoring module, a PCI Express line width test, allows you to confirm the accuracy of data with an online validation system, and can save screenshots or upload them to your website.
GPU-Z 0.5.8
(Windows, freeware, portable)
- GPU-Z.0.5.8.exe (0.9 MB)